Chad Rubin
May 12, 2026 · 12 min read
Operator notes by email
Short, opinionated takes on AI agents, Amazon PPC, pricing, and inventory. No fluff. About once a week.
Most Amazon brands treat inventory management like a spreadsheet problem. Open the file every Monday. Look at days of cover. Eyeball whether something needs a reorder. Maybe check the FBA inbound dashboard. Done.
That worked when you had 12 SKUs and one warehouse. It does not scale to 200 ASINs across multiple fulfillment centers, with promo calendars, BSR shifts, lead-time variance, and a competitive landscape that moves the math underneath you every week.
Inventory is not a spreadsheet problem. It is a signal problem. Demand pressure shifts. Lead times change. A competitor stocks out and your velocity jumps. Q4 rolls in and your forecast that worked for ten months suddenly underestimates by 40 percent. Each of those is a signal. The question is whether your inventory system reads them in time to act, or finds out next month when the P&L closes.
This playbook is the operator framework I run for myself and for the brands I work with. It assumes you have AI demand forecasting in your toolkit and need to operate it without it operating you.
## Key takeaways >- Amazon inventory management is a system of signals (demand pressure, lead-time variance, days of cover, competitive moves, promo windows, BSR slope), not a single number on a spreadsheet.- The three numbers every operator needs to set are days of cover target, reorder point, and safety stock. Get those wrong and the AI optimizes against the wrong floor.- Forecasts are probabilistic. Operating on the point estimate alone hides risk. Use confidence intervals to size safety stock and trigger early actions.- Stockouts on hero ASINs cost more than overstock on long-tail SKUs. The defensive playbook is asymmetric, and your inventory rules should be too.- Inventory decisions interact with pricing and PPC. A stockout-risk ASIN should pause ad spend and freeze price cuts at the same time, not days later when the dashboard finally agrees.
Most operators talk about PPC and pricing because those are loud. ACoS shows up daily. Buy Box loss flashes red. Inventory failures are quieter and far more expensive.
A stockout on a hero ASIN does three things at once. You lose the revenue during the outage. You lose the BSR position that took months to earn. And when you restock, your competitors have absorbed your traffic, your reviews have aged, and Amazon's algorithm needs weeks to trust your listing again. The visible cost is the lost sales. The invisible cost is the recovery curve.
Overstock is the opposite problem with the same root cause. You order based on a forecast that assumed steady demand. Q4 ends, demand drops 35 percent, and you are sitting on 8 months of cover when you planned for 3. FBA storage fees compound. Aged inventory fees hit at the 270-day mark. The cash you tied up in those units could have funded a launch, a new ASIN, or a paydown of debt. It is not.
From reading to action
If the framework above sounds familiar, your Amazon account is probably carrying the same drag. Apply and we will show what Marko, Oracle, and Bruno would change in your first week.

Ran a 7-figure Amazon brand for a decade. Founded Skubana (acquired). Co-founded Prosper Show. 15+ years on Amazon.
Join the brands that replaced agencies and tools with AI employees.
Both failures come from the same place: operating on point estimates instead of probability ranges, and reading signals too slowly.
Every reorder decision you make is the equilibrium of four forces. If you only think about one, you are flying blind on the other three.
Demand signal. What does BSR look like over the last 30 days? Is the trend stable, accelerating, or decelerating? Is your trailing 14-day velocity moving in the same direction as your trailing 90-day? Demand signal tells you whether the past is a guide or a lie.
Lead-time variance. How long does your supplier actually take, not what they promise? Does it vary by season? Does customs add 5 to 20 days? Lead-time variance is what safety stock is for, and most operators size it too small because they use the average instead of the worst case.
Competitive pressure. Is a competitor running low? Did a new entrant just launch in your subcategory? Competitive moves shift your effective demand. A competitor stockout can double your velocity overnight, and your inventory rules should react.
Channel commitments. Promo calendar. Subscribe and Save commitments. B2B deals. Lightning Deals you accepted three weeks ago that you forgot about. Channel commitments are velocity events you have already signed up for. They should be in the forecast, not surprises.
A real inventory system reads all four. A spreadsheet reads one (last month's sales) and calls it forecasting.
Before AI does anything useful with inventory, you have to set three numbers per ASIN. Wrong numbers means wrong decisions. Right numbers means the AI does its job.
Days of cover target. How many days of inventory you want to hold at current velocity. For most private label brands, the target lives somewhere between 45 and 90 days. Below 30 is risky. Above 120 is wasteful. The target should vary by ASIN profile: hero ASINs run higher, long-tail SKUs run lower.
Reorder point. The days-of-cover number that triggers a reorder. Reorder point equals lead time plus safety stock buffer. If your supplier takes 30 days and your safety buffer is 30, your reorder point is 60 days of cover.
Safety stock. Buffer for demand variance plus lead-time variance. The right safety stock is bigger than most operators think because they size for the average instead of the 95th percentile. If your supplier sometimes takes 45 days instead of 30, your safety stock has to absorb that gap.
These three numbers are the inputs the AI optimizes against. Get them right and the AI does its job. Get them wrong and the AI executes against the wrong floor. The floor and ceiling math post on pricing has the same shape: garbage settings, garbage decisions.
Days of cover, reorder point, and safety stock is its own deep-dive post with worked examples.
The single biggest mistake I see in Amazon inventory management is operators treating a forecast like a fact. The forecast says you will sell 800 units next month. So you order to hit that.
Real forecasts are distributions, not numbers. A good AI forecast says "the most likely outcome is 800 units, but the 90 percent confidence interval is 620 to 980." That spread is the actual information. The 800 is just the middle.
When you operate on the point estimate, you miss two things:
Safety stock exists for the downside. Reorder cadence exists for the upside. Both need the spread, not the point.
A real AI demand forecaster gives you confidence intervals, not just numbers. If your tool only gives you point estimates, it is hiding the part of the answer you actually need. The AI demand forecasting post covers what "confidence interval" actually means for an operator and how to use it.
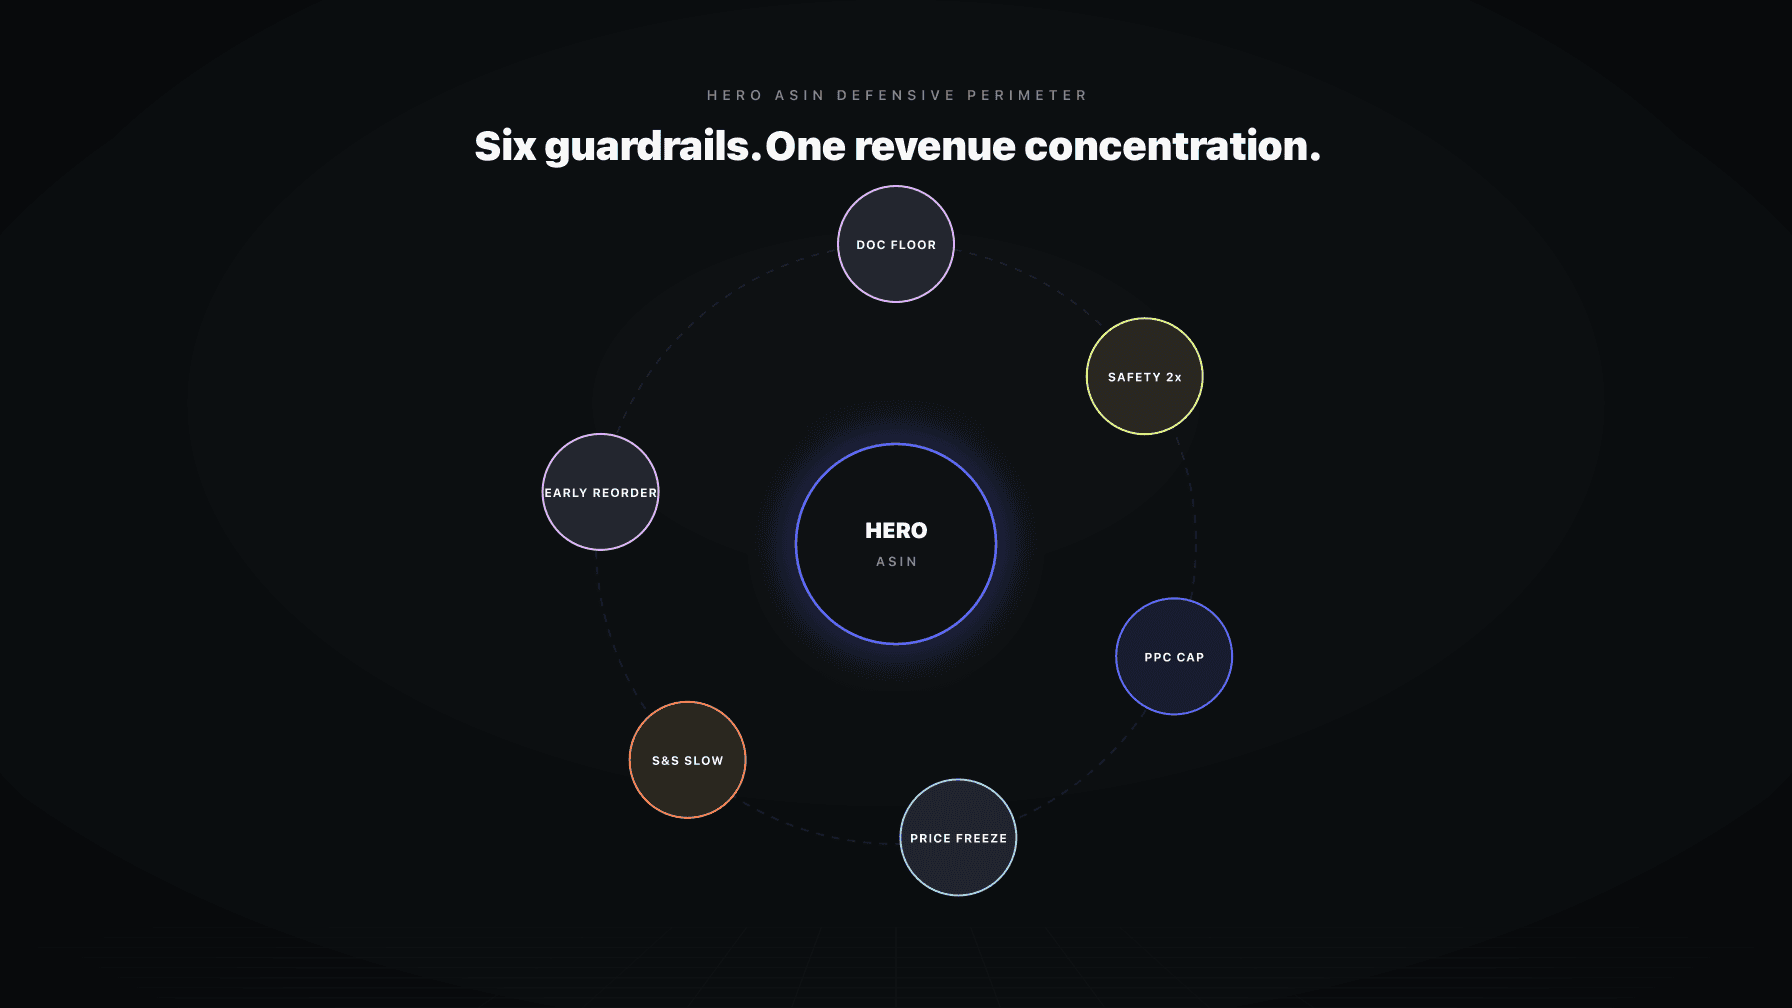
The cost of stocking out on your top revenue ASIN is not the same as the cost of stocking out on a long-tail SKU. Yet most inventory tools apply the same rules to both. That is wrong by design.
Hero ASIN logic should be defensive:
Long-tail SKU logic can be lighter:
The mistake is applying hero logic to everything (you over-invest in low-impact SKUs) or applying long-tail logic to everything (you under-protect your revenue concentration). Tier your ASINs explicitly. The stockout prevention playbook walks through how to operate the defensive tier in detail.
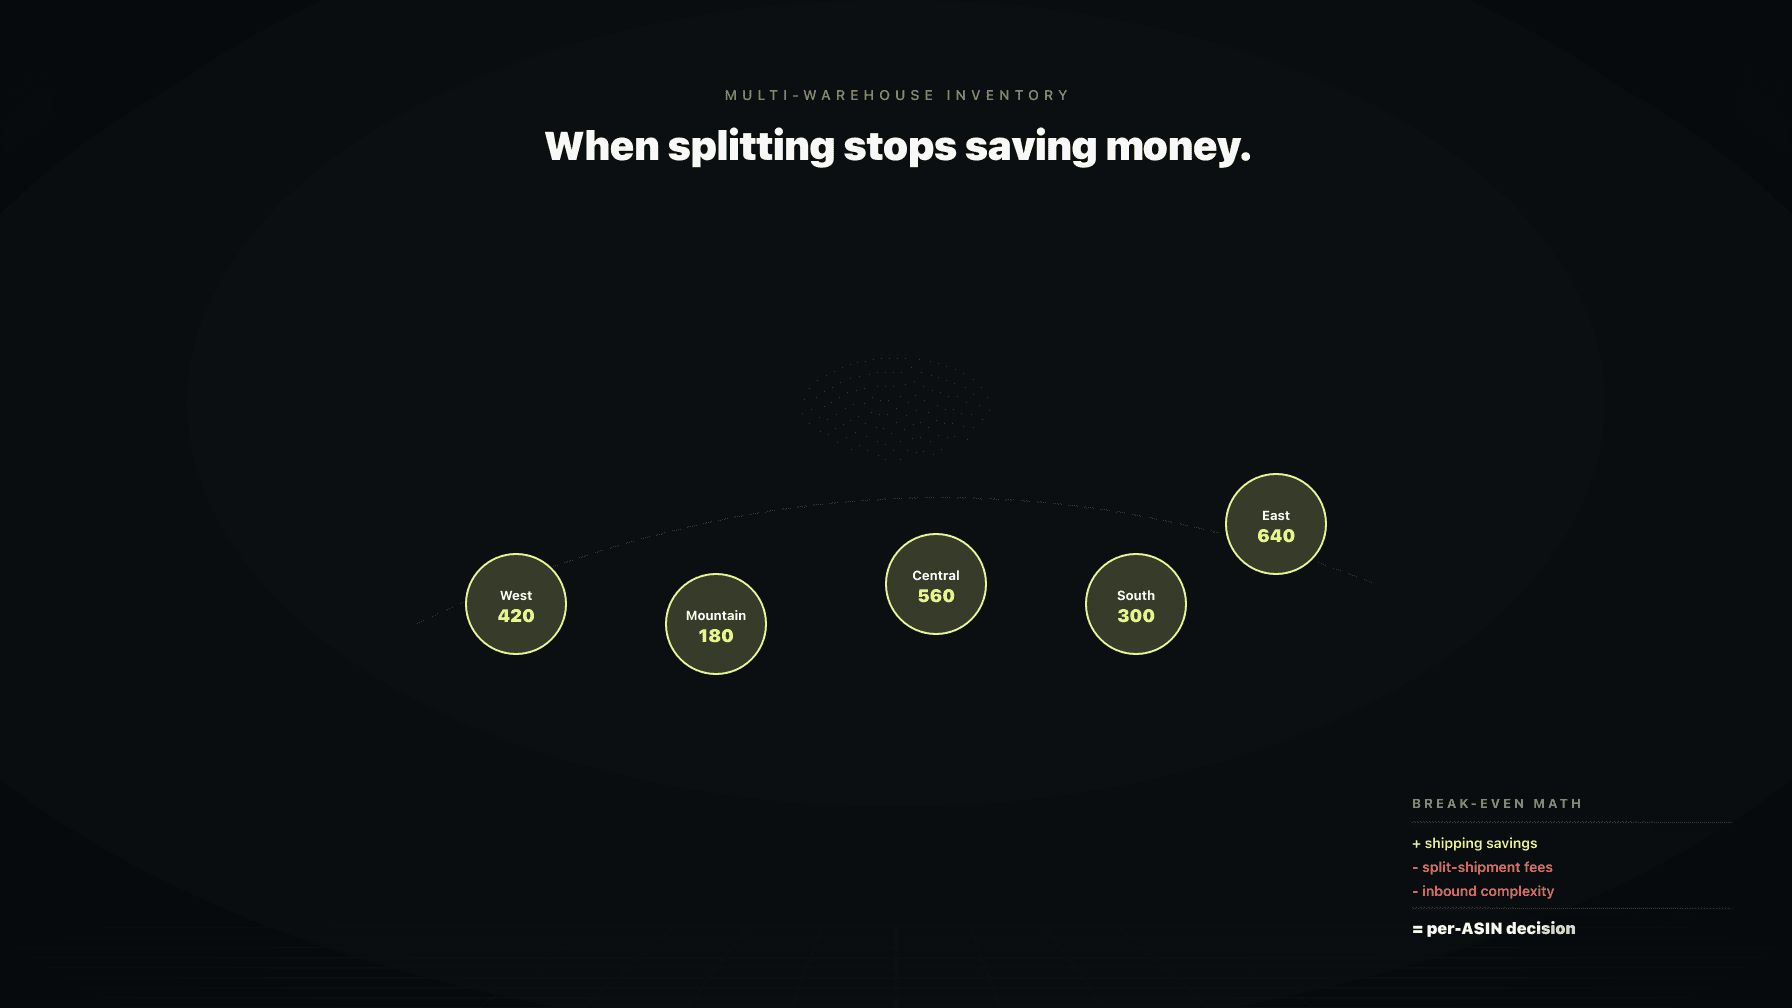
Distributed inventory across multiple fulfillment centers reduces transit time and shipping costs. That is the Amazon pitch and it is true up to a point.
The point is when the operational cost of splitting exceeds the shipping savings. That happens earlier than most operators realize. Three signs you have crossed the line:
You are paying split-shipment fees. Amazon charges to balance inventory across FCs when you ship in a single shipment that should have been split. If you are paying this regularly, your inbound plan is fighting the distribution model.
You have stockouts in one region and overstock in another. Distribution only works when demand patterns match the regional split. If demand is concentrated in one region, splitting hurts more than it helps.
Your average distance to customer has not actually dropped. Some categories Amazon serves from regional FCs regardless. Splitting your inventory does not change the customer experience for those. You ate the operational cost without getting the shipping speed.
When to split, when to consolidate, and when to use a 3PL with FBM are real decisions. The multi-warehouse and distributed inventory post walks through the math.
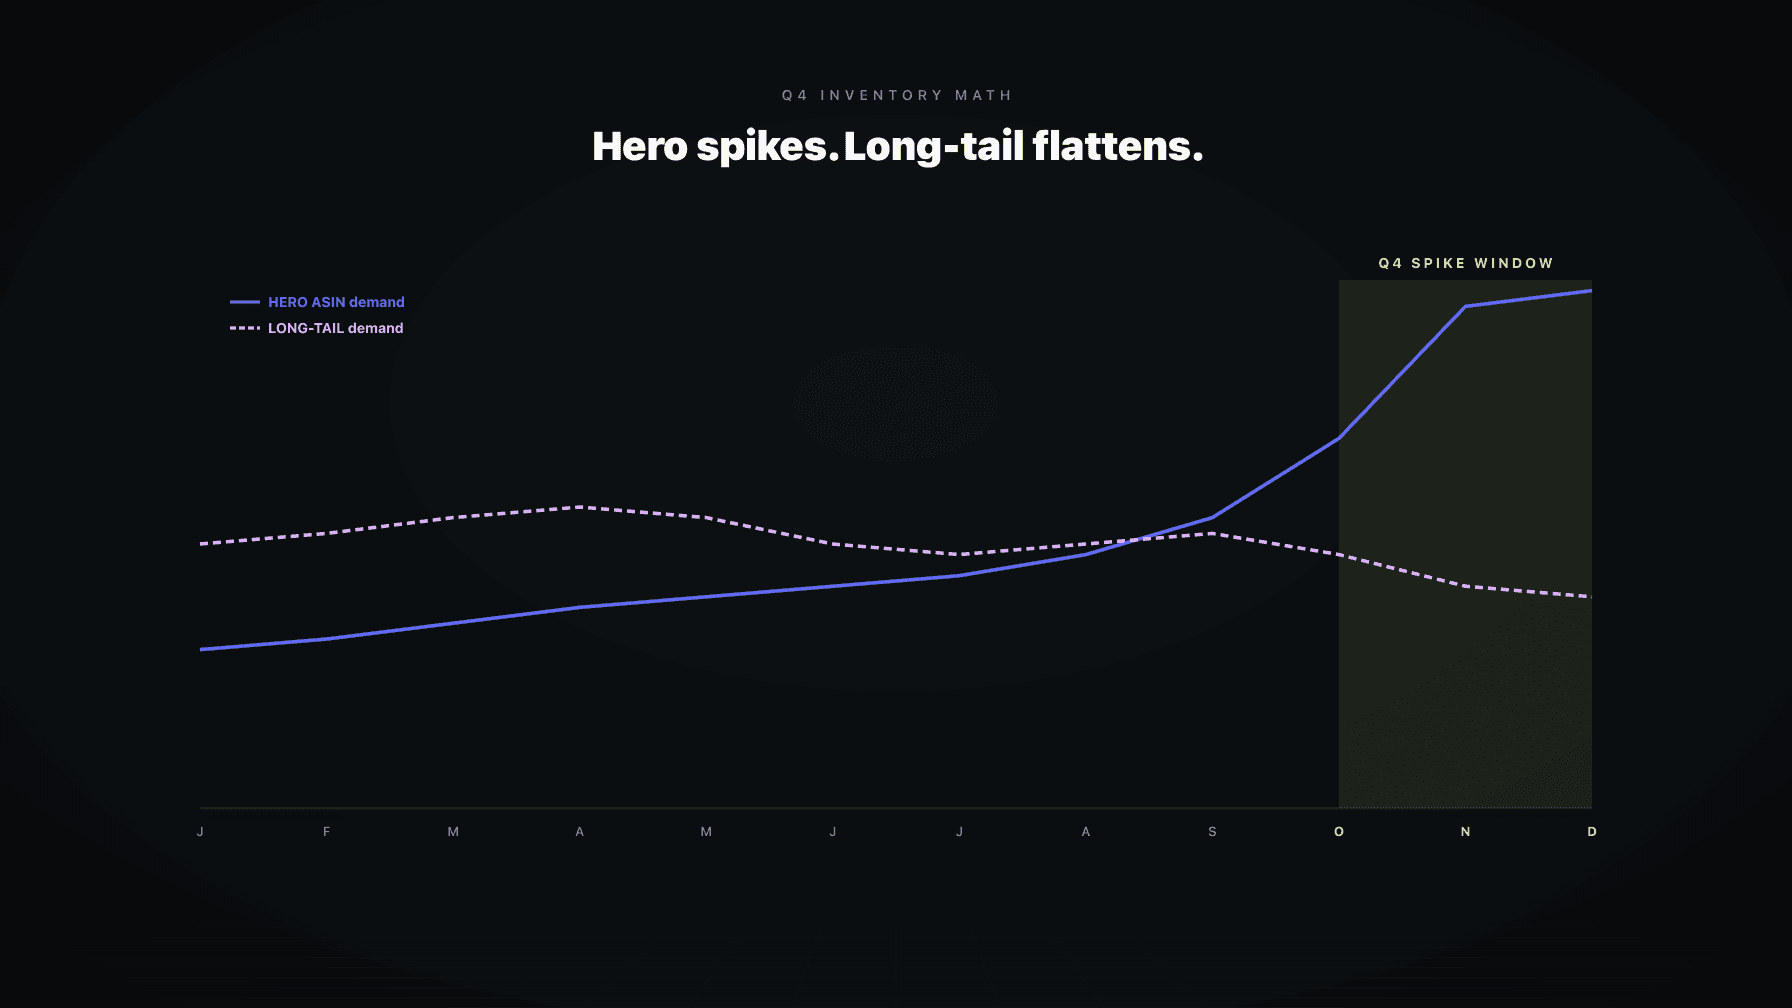
The same way Q4 breaks static pricing rules, it breaks static inventory rules. The forecast that worked for ten months suddenly under-estimates by 30 to 50 percent on hero ASINs and over-estimates by 20 to 40 percent on long-tail.
Why? Because Q4 is not just higher demand. It is concentrated demand on specific SKUs with specific promo windows. The aggregate forecast does not tell you which SKUs and which weeks.
The defensive Q4 inventory playbook:
This is asymmetric. Most brands over-order long-tail and under-order hero in Q4 because they apply the same rules to both. The result is overstock on the wrong SKUs and stockouts on the right ones. Q4 inventory math covers the operator playbook in detail.
Inventory decisions cannot live in isolation. A stockout-risk ASIN should not just trigger a reorder. It should also:
Most operators do this with calendar reminders and Slack messages. The brands that win in 2026 do it with shared state. The pricing agent reads inventory state in real time. The PPC agent reads inventory state in real time. When days of cover drops, all three systems adjust at the same time, not on different schedules.
This is the pricing × PPC × inventory coordination thesis, applied from the inventory side. The pricing cluster pillar makes the same argument from the pricing side. Both converge on the same structural answer: coordinated agents beat stacked tools.
If you are evaluating AI demand forecasting and inventory tools, three things matter more than the rest.
1. It optimizes for cash position, not just stockout avoidance. A tool that minimizes stockouts at any cost will tell you to over-order everything. That ties up cash you need elsewhere. Real AI inventory software balances stockout risk against cash efficiency and surfaces the trade-off explicitly.
2. It exposes confidence intervals, not just point forecasts. If the dashboard says "you will sell 800 next month" and gives you no spread, you cannot size safety stock correctly. The good tools give you the full distribution.
3. It coordinates with pricing and PPC in real time. A standalone inventory tool that does not talk to your repricer or your ad platform is a 2018 product. The 2026 model is shared state across all three.
Everything else (UI, reports, integrations) is secondary. The decision-making framework matters more than the cosmetics.
Failure 1: Operating on the average forecast. Point estimates hide tail risk. Operators that ignore confidence intervals over-order on stable SKUs and under-order on volatile ones. The math is right, the operator is wrong.
Failure 2: Same rules across all ASINs. Hero ASINs need defensive rules. Long-tail SKUs need light rules. Applying the same logic to both means you over-protect what does not need it and under-protect what does.
Failure 3: Inventory siloed from pricing and PPC. A stockout-risk ASIN that keeps absorbing ad spend at full price is bleeding money from three directions at once. The fix is shared state, not better dashboards.
These are not edge cases. They are the median brand's experience.
Daily review is too short for most decisions. Monthly is too long. Weekly is the right cadence for most accounts, with daily exception handling for emergencies.
What goes in a weekly inventory review:
This is also where you tune the AI's settings, not on a daily basis. Daily tweaking creates whiplashed configurations.
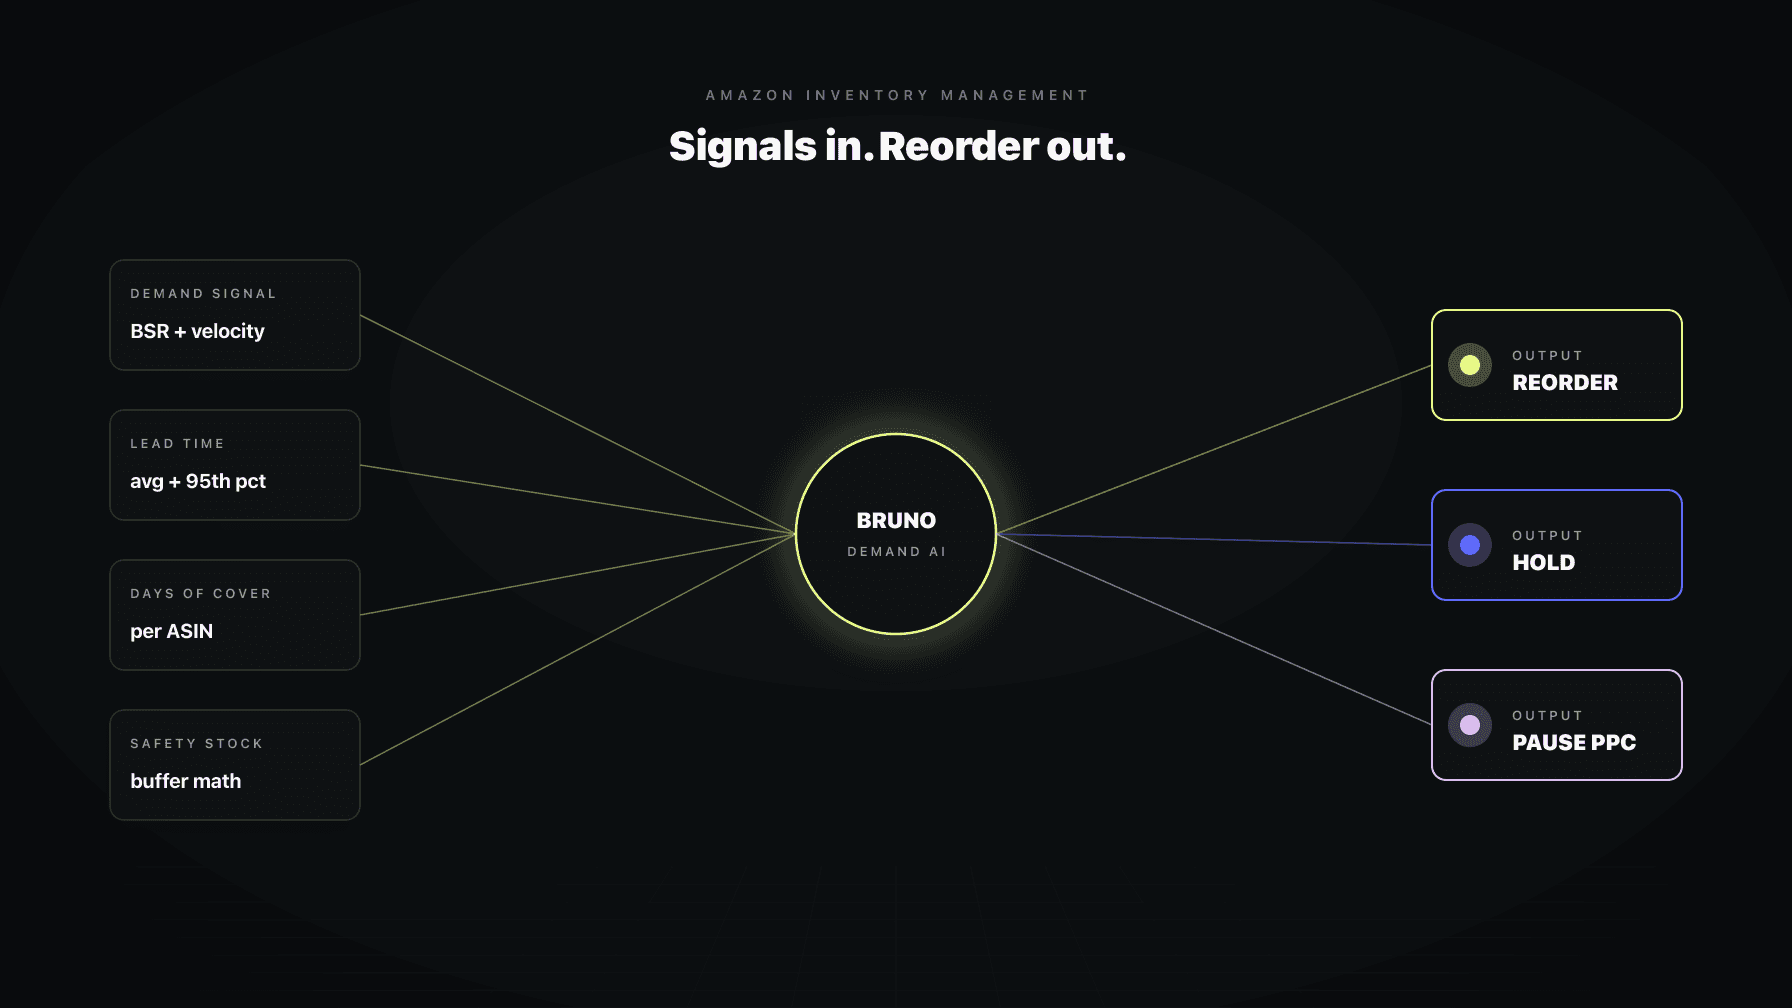
Bruno is the AI demand-planning employee we built at Profasee. Bruno does not run alone. That is the key difference from standalone inventory tools.
When Oracle raises a price, Bruno sees the new velocity baseline and updates the forecast. When Marko increases ad spend on an ASIN, Bruno accounts for the velocity acceleration in days-of-cover math. When inventory drops below a threshold, Bruno tells Oracle to freeze cuts and tells Marko to pull spend in the same minute. Operator sees one notification, not three.
Coordination across pricing, PPC, and inventory is the feature. No standalone inventory tool can do it because no standalone tool has access to the other systems in real time.
Run on signals, not spreadsheets. Set days of cover target, reorder point, and safety stock per ASIN, then let an AI demand forecaster operate against those settings while you review weekly. The brands that win read demand signal, lead-time variance, competitive pressure, and channel commitments as inputs to every reorder decision. The brands that lose read last month's sales and call it forecasting.
Reorder point equals lead time plus safety stock buffer, all measured in days of cover. If your supplier takes 30 days on average and varies up to 45, and your demand can spike up to 20 percent above forecast, your safety stock should cover both gaps. Most operators size safety stock for the average instead of the 95th percentile and run out when reality hits the tail.
Days of cover is current inventory divided by trailing velocity. It tells you how long your stock lasts at current sales rate. Absolute stock numbers do not tell you that. An ASIN with 500 units and 50-per-day velocity has 10 days of cover. An ASIN with 500 units and 5-per-day velocity has 100 days. Same stock, completely different operating decision.
Run asymmetric rules. Hero ASINs need higher days-of-cover targets (90 to 120), bigger safety stock buffer (2x lead-time variance), earlier reorder triggers, and automatic guardrails on pricing and PPC when cover drops. Long-tail SKUs can run lighter rules. The mistake is applying the same logic to both.
Sometimes. Multi-warehouse helps when demand patterns match the regional split and your shipping savings exceed the operational cost of splitting. It hurts when you are paying split-shipment fees regularly, when demand is concentrated in one region, or when your category serves from regional FCs anyway. Run the math per ASIN, not as a default.
Traditional planning uses point estimates from historical sales. AI demand forecasting uses probabilistic models that produce confidence intervals. The interval is the actual information. Point-estimate planning over-orders stable SKUs and under-orders volatile ones because the math is averaging over outcomes that should be handled separately.
Weekly for tactical exception handling. Monthly for tuning days of cover target, reorder point, and safety stock at the ASIN level. Quarterly for tiering (which ASINs are hero, which are long-tail). Daily tuning creates whiplashed settings. Long gaps between reviews mean stale rules that no longer match the business.