Chad Rubin
May 15, 2026 · 12 min read
Operator notes by email
Short, opinionated takes on AI agents, Amazon PPC, pricing, and inventory. No fluff. About once a week.
The default Amazon pitch for the last few years has been the same. Split your inventory across more fulfillment centers, place units closer to the customer, watch transit times drop, watch conversion lift. Amazon's own placement programs are built around it.
It is true. Up to a point.
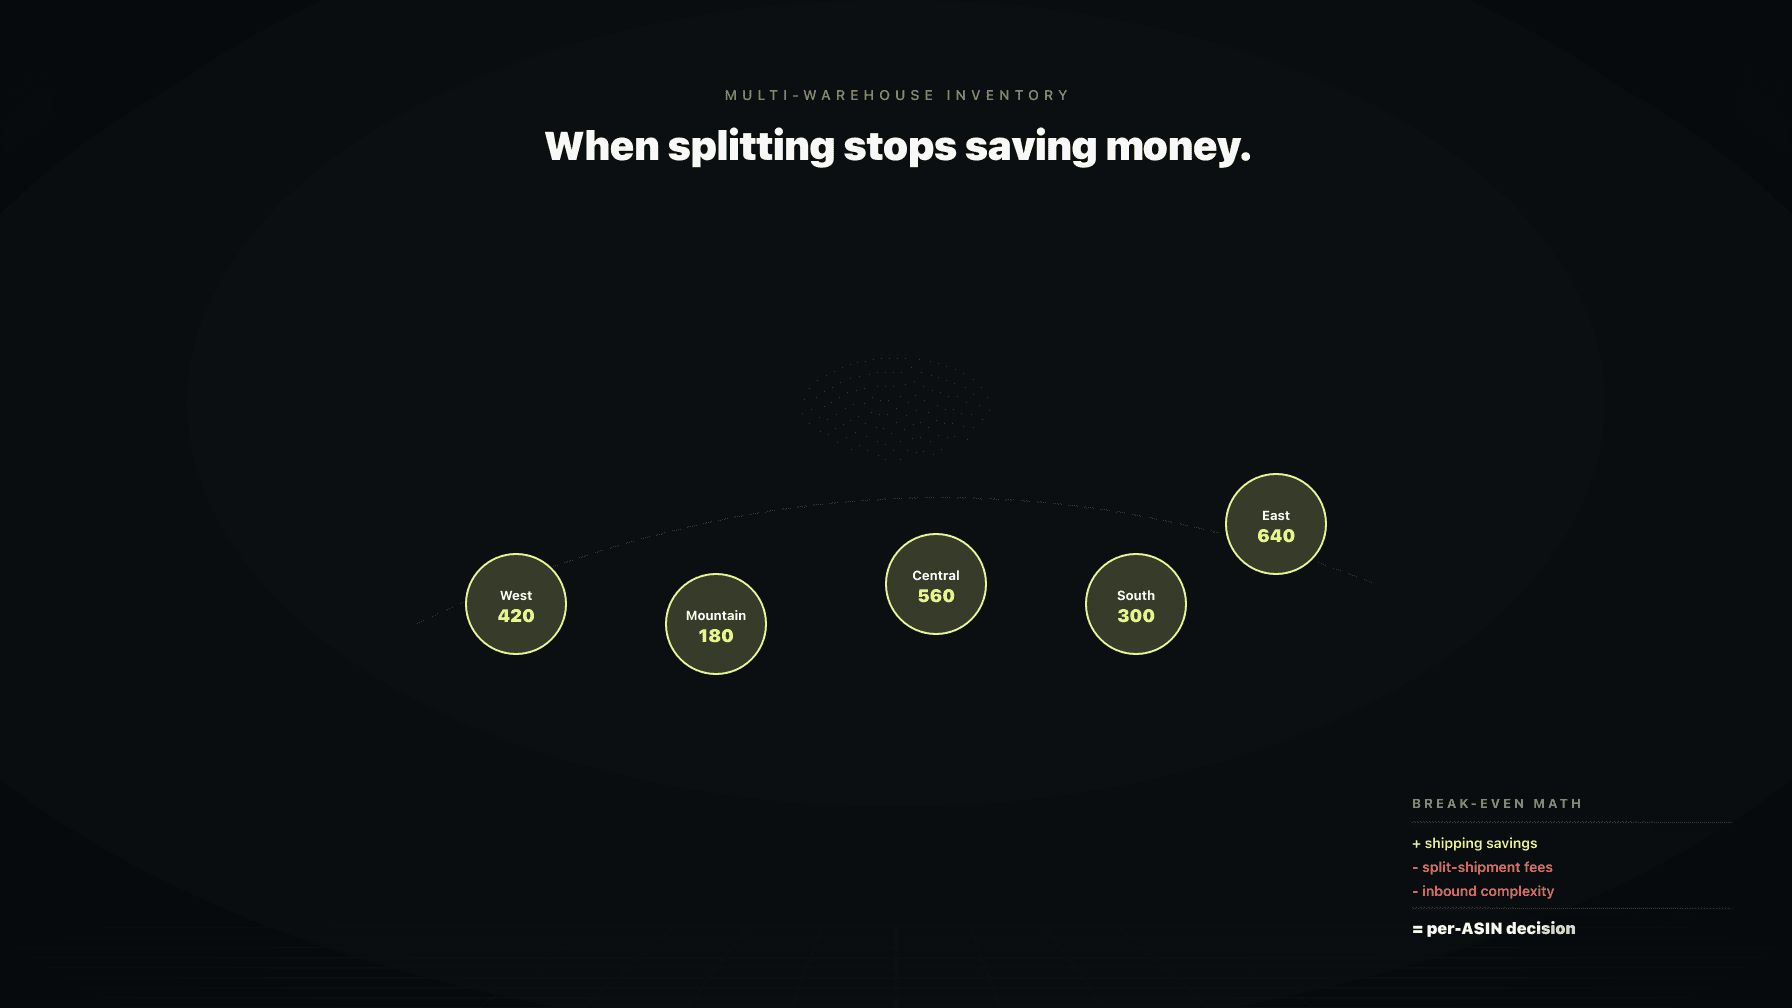
There is a crossover line on every ASIN where splitting one more pallet across one more region stops saving money and starts costing it. Past that line, every extra split adds inbound complexity, split shipment fees, working capital tied up in safety stock at four locations instead of one, and operator hours your team is not getting paid for. Most operators I talk to have no idea where that line sits on their catalog. They distribute by default because the dashboard told them to.
This post is the math an operator should walk through per ASIN before sending the next PO into the inbound queue.
The pitch goes like this. Customer in Florida orders at 9pm. If your unit is in a Jacksonville FC, it ships next day. If the unit is in Pennsylvania, Amazon either transfers it (you pay) or routes it long-haul (slower, lower conversion). Solution: pay to seed inventory in multiple regions up front.
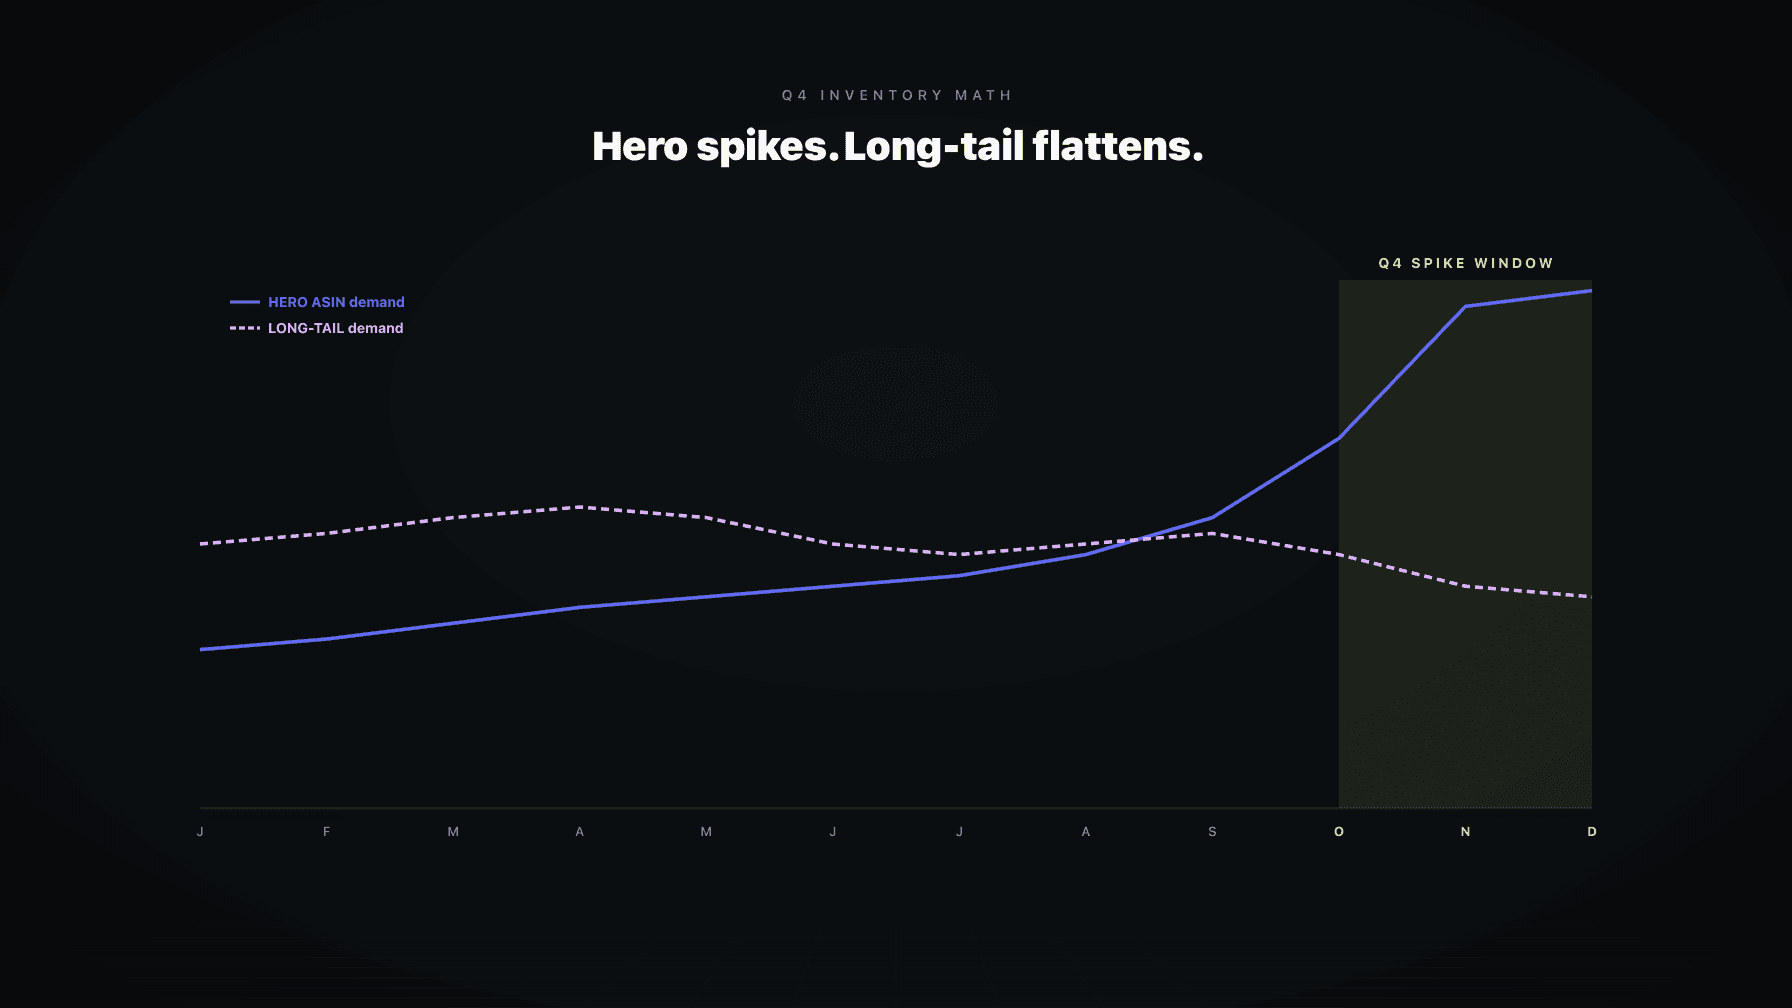
That story is real on the high-velocity end of your catalog. Hero ASINs that move dozens of units a day per region benefit from local stock. Conversion lift on a true one-day badge versus two-day is measurable, usually two to six percent depending on category. For a top-five SKU, that lift is worth the cost of placement.
The story stops being real at the long-tail end. A SKU that moves four units a day across the entire US does not need to be in eight FCs. Eight FCs means eight reorder points, eight safety stock buffers, and a much higher probability that one region runs out while another sits on six months of cover. The conversion lift on that SKU is rounding error because the purchase decision was driven by reviews and price, not by whether the badge said one day or two.
From reading to action
If the framework above sounds familiar, your Amazon account is probably carrying the same drag. Apply and we will show what Marko, Oracle, and Bruno would change in your first week.

Ran a 7-figure Amazon brand for a decade. Founded Skubana (acquired). Co-founded Prosper Show. 15+ years on Amazon.
Join the brands that replaced agencies and tools with AI employees.
The pitch also assumes your inbound side is free. It is not. Every additional destination is another pallet, another set of carton labels, another carrier appointment, another inbound discrepancy risk.
You can usually tell you have over-distributed before you run the math. Watch for three patterns.
First, your inbound shipment plans keep getting broken into more destinations than makes sense. You send 800 units, Amazon's placement service splits them into six FCs, three getting under 50 units. The per-carton cost of getting 40 units to a low-velocity FC is brutal. Your CPU on those small splits can quietly run two or three times your average inbound rate.
Second, your account shows simultaneous stockouts and overstock across regions for the same ASIN. The Northeast is dry, the West has eight weeks of cover. That is not a forecasting failure. That is a distribution structure failure. Your safety stock is funding the wrong shelves.
Third, your removal and disposal volume is climbing on ASINs that are not actually slow movers in aggregate. They are slow at one location, fine in aggregate, and you are paying long-term storage at the slow location while replenishing at the fast one. It looks like a slow SKU on the surface and the real fix is structural.
If two of those three are happening on more than a quarter of your catalog, you are over-distributed.
Split shipment fees are the most under-tracked line on the inbound P&L. Few operators have a running cents-per-unit number for split fees paid across the year on each ASIN.
Amazon's inbound programs let you either ship to one location (cheaper per unit, Amazon distributes for you, slower receive) or ship to multiple (faster receive, higher per-unit cost, more inbound work). The single-destination path has a placement fee that scales with unit count and weight. The multi-destination path has zero placement fee but you pay all the freight to each destination yourself.
What operators miss: the placement fee on the single-destination path is not always smaller than the freight delta on the multi-destination path. It depends on weight, dimensions, distance, and what your freight forwarder charges per stop. A heavy unit shipped to six FCs at LTL rates can cost more per unit than the placement fee on the same units consolidated to one. A light, small unit via small parcel to six FCs can be cheaper than the placement fee.
Most operators pick a path per shipment based on which screen Amazon showed them last week. The cumulative cost difference at year-end can be five figures on a mid-sized catalog. The fix is a running cost table by weight band and unit count, pulled weekly against actual landed cost per unit.
There is a real case for distribution that is not about transit time. It is about regional demand variance.
Some categories show strong regional skew. Pool supplies tilt south. Snow gear tilts north. Sun protection skews coastal. Heating pads pick up earlier in the upper Midwest than in Texas. If your catalog has this skew and the data supports it, distribution pays off because the regions running hot are not the regions running cold.
The honest number: real regional skew is rare outside obvious seasonal categories. Most consumer products show even per-capita demand across regions, with the noise driven by ad spend distribution, not consumer preference. Operators see Texas as the top state and conclude "we need more inventory in the South." Texas was the top state because Texas is large and has more Prime members. Per capita, demand was flat.
Before you split on a regional skew theory, pull twelve months of unit sales by customer ship-to region and divide by region population or Prime household estimate. If the per-capita curve is flat within ten percent, there is no real skew. If the curve actually swings, distribute proportional to the swing, not evenly.
This is the part the placement-service pitch leaves out.
For high-velocity SKUs in many categories, Amazon already runs its own internal network rebalancing. They pull units from your receiving FC to other FCs as forward-deployed stock at their cost, not yours, because Amazon wants the conversion lift on their side. If you are paying placement to distribute on top of that, you are funding distribution Amazon would have done for free.
How to tell. Pull the inbound receive history on a given ASIN over six months and compare receiving FC against shipped-from FCs. If you only received into PHL but units shipped from five other regions, Amazon redistributed for you. You did not pay the freight on that transfer.
The pattern roughly tracks small, light, high-velocity consumables. Vitamins, beauty, small kitchen, pet treats. Heavy, slow, oversize usually does not get internal redistribution. Separate your catalog into "Amazon already distributes this" and "Amazon will not." Cut placement spend on the first bucket. Run the breakeven math on the second.
Inbound complexity is the cost nobody puts in the spreadsheet because it does not show up as a fee. It shows up as people-hours.
Every additional destination adds work. Different carton mix. Different pallet config. Different appointment scheduling. More chance a carton goes to the wrong FC and the shipment is split incorrectly on Amazon's side, which takes weeks to reconcile. Your inbound discrepancy rate scales with destinations, not units.
In-house, the math is hours per shipment times loaded labor rate. Outsourced, it is per-touch fees that scale with destination count. On a mid-sized catalog moving multiple POs a month, the inbound complexity cost can run thousands a month that nobody is tracking as part of the distribution decision.
Ask: what would your inbound process cost if every shipment had one destination instead of five? That delta is what you are spending on distribution complexity. If the lift is smaller than the complexity cost, consolidate.
Several scenarios where consolidating to a single inbound destination is the right move.
Small, light, high-velocity SKUs in categories where Amazon redistributes internally. Single inbound, let Amazon move it for free.
New ASIN launches with no demand history. Distributing across six FCs at launch means five of them might be dead inventory for ninety days. Send to one FC, watch the sell-through pattern emerge, then decide whether to distribute on the next PO.
Low-margin SKUs where the placement fee is a meaningful chunk of unit margin. If your contribution margin is fifteen percent and the per-unit cost difference between paths is two or three percent, that is a fifth of your profit on the decision.
Pre-Q4 buildup on SKUs where you are confident on the aggregate forecast but unsure on regional split. Let Amazon distribute. Worst case you are slightly slow on transit time during peak. Best case Amazon distributes correctly and you saved placement spend on what is usually your largest inventory month.
The pattern: when you are uncertain about regional demand, when the SKU is small and high-velocity, when margin is thin, default to consolidation. Distribution should be a deliberate choice on SKUs where you have a real reason, not the default on every PO.
There is a separate distribution lever most operators do not pull: a buffer outside Amazon's network entirely. A 3PL warehouse you control, or your own FBM operation. Not a replacement for FBA. Three specific situations.
One: oversize and heavy SKUs where Amazon's storage and placement fees are punishing. Shipping from your own 3PL via FBM, with a slower badge but better margin, can beat FBA on the worst-fee subset of your catalog.
Two: protection against inbound delays. Q4 inbound queues get long. If your only inventory is in transit to Amazon and the receive takes three weeks, you are dark for three weeks. A 3PL buffer you can ship FBM out of keeps you alive during receive backups.
Three: the long-tail and seasonal tail. SKUs that move slowly enough that FBA storage is most of their margin. They do better sitting at a low-cost regional 3PL with FBM enabled.
The right catalog usually has a clear FBA layer (heroes, fast movers) and a clear 3PL or FBM layer (oversize, seasonal, long-tail, buffer stock). The middle is where the per-SKU math matters most.
The routine. Repetitive, and nobody owns the cross-system view, which is why it rarely gets run.
Step one. Per ASIN, calculate expected conversion lift from distributed placement. Category benchmark for one-day versus two-day badge lift, times current unit velocity. That is gross benefit per month.
Step two. Per ASIN, calculate all-in cost. Placement fees, freight delta, inbound labor or 3PL touch fees, safety stock cost of money on extra units in extra locations.
Step three. Compare. If gross benefit beats gross cost by a comfortable margin, distribute. If they are close, consolidate, because close-call cases lose money once you account for the soft costs (inbound errors, dead inventory at slow FCs, operator hours).
Step four. Re-run quarterly. Velocity changes. Margin changes. Fee structures change. A clear distribute candidate in March might be a clear consolidate by September.
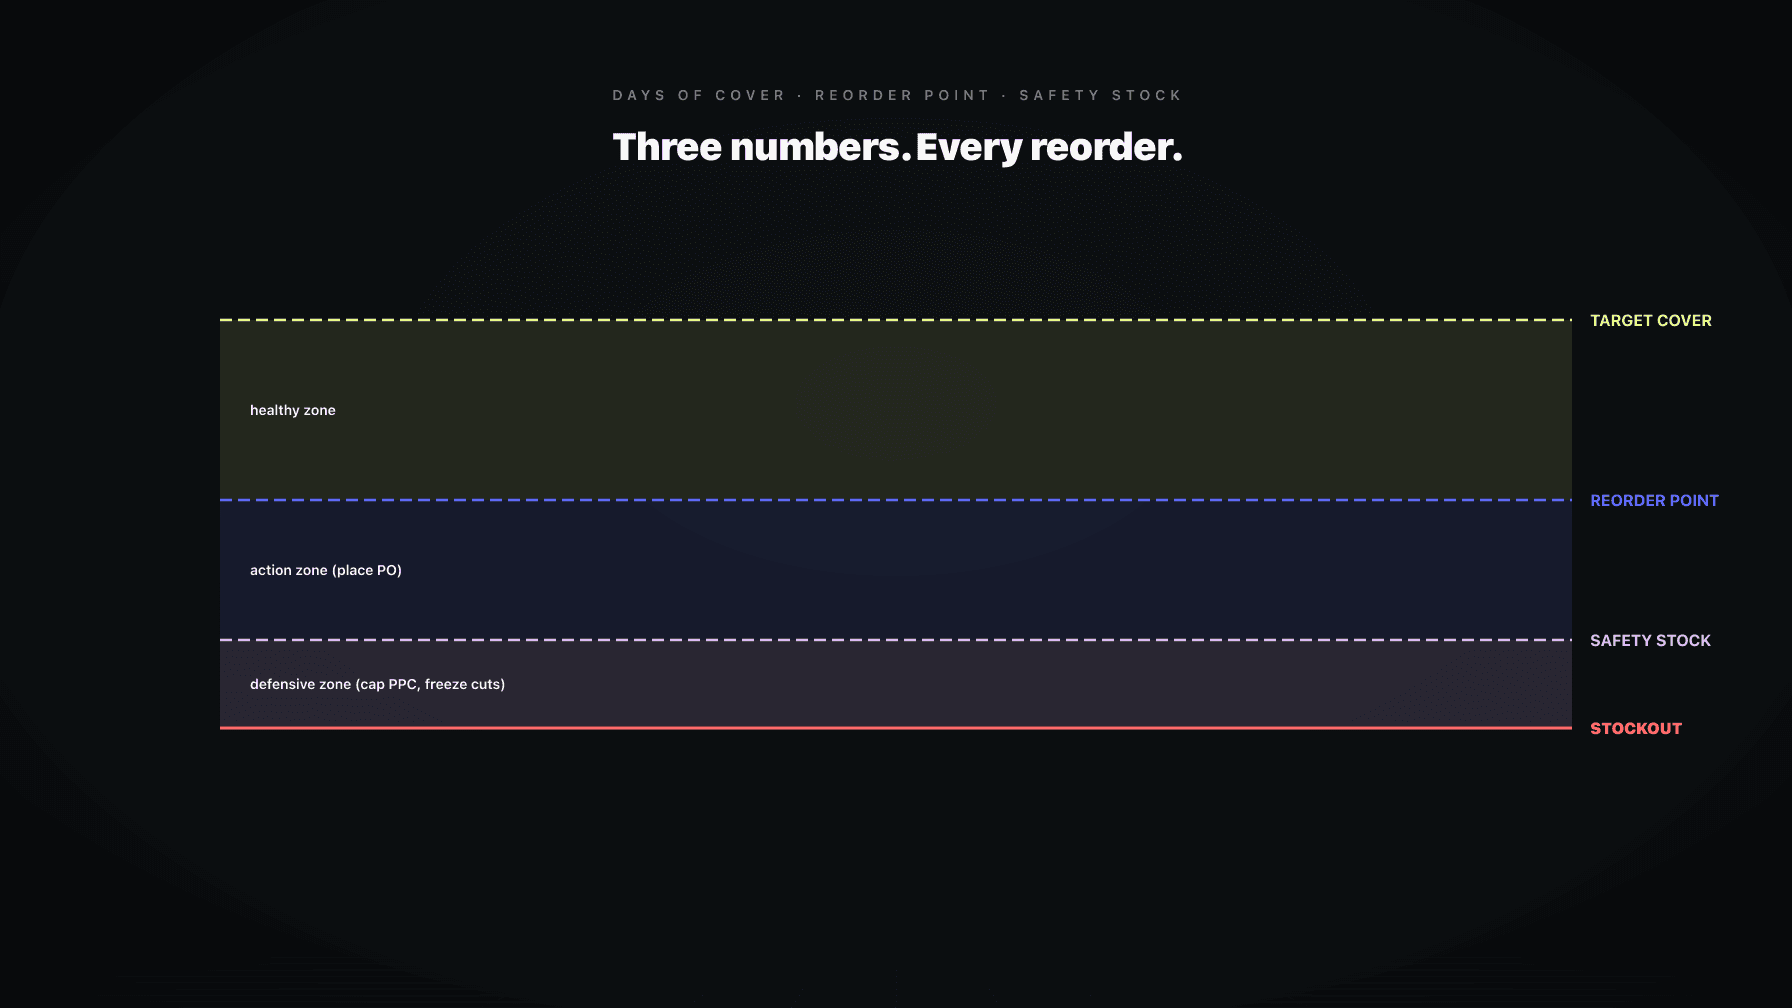
Step five. Tie the call back into reorder point and days-of-cover math. A distributed SKU has higher effective safety stock (regional stockouts hit separately) and longer effective lead time (internal rebalancing is not free or instant). See days of cover, reorder point, and safety stock.
Most operators run step one, get excited about the conversion lift number, and skip the rest.
Bad software shows you a map of your inventory across FCs and lets you feel like you can see the network. That is dashboard theater. Looking at the map does not change a decision.
Good software does three things.
It runs the breakeven math per ASIN, on a current week's cost basis, and tells you which SKUs are on the wrong side of the line. Not "here is your distribution," rather, "these twelve SKUs are paying for distribution that is not earning out, consolidate on the next PO."
It tracks split shipment fee accumulation per SKU over time. You should be able to see that ASIN X paid eleven hundred dollars in placement fees over a quarter, against three hundred dollars of measurable conversion lift. That is a losing SKU on the distribution decision and the system should call it out.
It connects the distribution decision to reorder points, lead times, and the pricing layer. The same SKU might want a different price floor when distributed versus consolidated. If your inventory tool and pricing tool do not talk, decisions in one system quietly break math in the other. That is the cross-system problem covered in pricing, PPC, and inventory coordination.
The goal is not to pick distributed or consolidated as a strategy. The goal is to pick correctly on every SKU on every PO.
Bruno is the AI demand planner inside Profasee's inventory management layer. The distribution decision is one of the calls Bruno makes per SKU, not as a default.
Bruno tracks regional velocity on every ASIN, separates real regional skew from population-weighted noise, and watches Amazon's internal redistribution behavior on your account. For SKUs Amazon already redistributes for free, Bruno does not recommend paid placement. For SKUs with real regional skew, Bruno recommends proportional distribution sized to the skew, not even splits.
Split shipment fee history is tracked per ASIN. The system surfaces SKUs where placement spend is not earning its keep against measured conversion lift, and flags the inverse: SKUs sitting consolidated that would clear the breakeven line if distributed.
Because Bruno sits in the same layer as the pricing engine, the distribution call feeds into pricing floors and reorder math directly. The same logic flows into demand forecasting, so the next forecast cycle uses the updated distribution as input.
On your hero ASINs, often yes. On the rest of the catalog, run the math first. Distribution pays off on high-velocity SKUs with real regional demand variance. On slow movers, small catalogs, and SKUs Amazon already redistributes internally, paid distribution is usually a net loss. The default should be consolidation with deliberate exceptions, not the other way around.
A split shipment fee is the placement cost Amazon charges when you send inventory to a single inbound destination and Amazon distributes it across the network for you. You can avoid it by sending to multiple destinations yourself, but that adds freight and inbound labor. The right answer per shipment depends on unit weight, count, and freight rates. Track landed cost per unit on both paths and pick the cheaper one per PO. There is no universal right path.
When the conversion lift from faster transit times beats the combined cost of placement fees, extra freight, additional safety stock, and inbound complexity. That is usually true on top-velocity SKUs in categories where Prime one-day badging moves the needle on the buy box. It is usually not true on slow movers, on heavy or oversize items, or on categories where customers buy on review depth and price rather than shipping speed.
For a meaningful slice of most catalogs, yes. Oversize and heavy items where FBA fees eat the margin. Seasonal long-tail where storage fees outrun the velocity. Buffer stock against inbound delays. FBM via your own 3PL is not a replacement for FBA on your heroes. It is a complementary layer that covers the SKUs where FBA is the wrong economic fit.
Pull the inbound receive history on a high-velocity ASIN over the last six months. Compare the receiving FC against the shipped-from FCs on customer orders. If units shipped from FCs you never sent inventory to, Amazon redistributed your stock internally. The categories where this happens most are small, light, high-velocity consumables. Heavy, slow, or oversize categories usually do not get internal redistribution and require paid placement for regional coverage.
For most catalogs at that scale, three to four FCs is plenty, and most brands are over-distributed past that. The exception is highly seasonal or regionally skewed categories where you have data showing real per-capita variance. If you do not have that data, default to consolidation and let Amazon's network do the regional work. As you scale into eight figures and your hero SKUs hit higher velocity per region, the math on more FCs starts working. Below that, more locations usually means more complexity than benefit.
A distributed SKU has separate stockout risk in each region, which means effective safety stock requirement is higher than a consolidated SKU at the same total cover. Internal rebalancing takes time, so effective lead time stretches on the distribution side. Both have to flow into reorder point math, or you will run regional stockouts even when aggregate cover looks healthy. This is why distribution and reorder math cannot live in separate tools.