Chad Rubin
May 16, 2026 · 12 min read
Operator notes by email
Short, opinionated takes on AI agents, Amazon PPC, pricing, and inventory. No fluff. About once a week.
Here is the part of Q4 nobody admits in January. You did not lose money because you ran out of inventory. You did not lose money because you sat on inventory. You did both, on different SKUs, inside the same plan. The post-mortem blames the forecast or the freight desk. The real problem was upstream of both.
Most Q4 plans apply a uniform multiplier to non-uniform demand. The operator looks at last year, adds a percentage for growth, pushes the same lift across the catalog. Hero gets 1.6x. Long-tail gets 1.6x. The math is clean. The result is wrong in two directions at once. Heroes spike harder than the multiplier, so they stock out in week two of November. Long-tail spikes softer, so it sits in FBA through February burning storage fees.
A brand with 200 ASINs does not have 200 Q4 curves. It has roughly four. Heroes with deal exposure. Heroes without deal exposure. Mid-velocity with seasonal lift. Long-tail that moves the same in October as in February. Treating those four buckets as one produces the simultaneous over-and-under-order. The fix is not a smarter multiplier. The fix is a plan built per tier, with different reorder timing, safety stock, and price-floor behavior.
This is the operator math for the 2026 Q4 window. The dates are concrete. The failure modes are the ones we have actually run into.
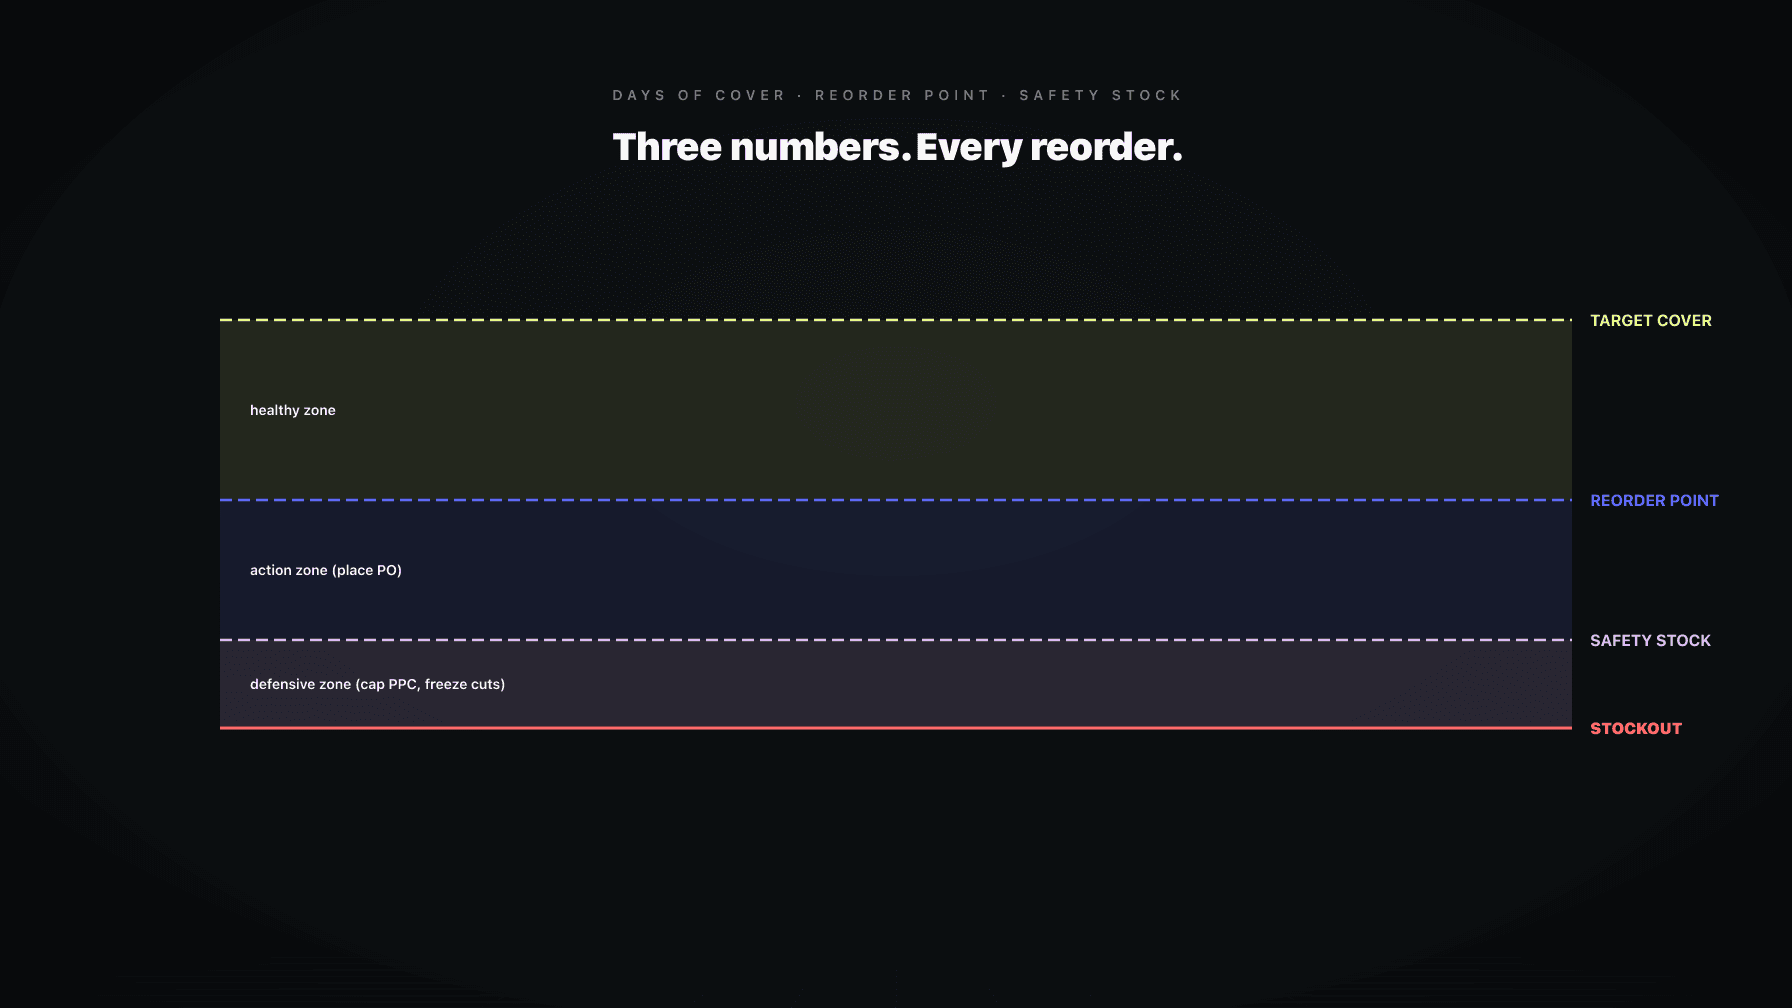
Static inventory rules work in a stable demand environment. You set days of cover, a reorder point, safety stock as a function of lead-time variance, and let the system run. Eight months of the year, the math holds. Q4 breaks it because three variables the static model treats as constants are no longer constant.
Demand variance moves. Outside Q4, a hero's weekly velocity might swing 15 percent around its mean. Inside the holiday window, the same SKU can do 4x its weekly average in a single Lightning Deal day, then 0.6x the following week. The safety stock formula was calibrated on the wrong distribution.
From reading to action
If the framework above sounds familiar, your Amazon account is probably carrying the same drag. Apply and we will show what Marko, Oracle, and Bruno would change in your first week.

Ran a 7-figure Amazon brand for a decade. Founded Skubana (acquired). Co-founded Prosper Show. 15+ years on Amazon.
Join the brands that replaced agencies and tools with AI employees.
Lead time moves. Container space tightens in late September. FBA receiving slows down from mid-November through mid-December. A 35-day lead time in July is a 55-day lead time in October if you did not book early.
The cost of being wrong moves. A stockout in March costs you one week of sales and a small BSR dip. A stockout on November 18 costs you that week, plus the deal slot, plus the velocity needed to defend rank, plus the SnS customers who got a cancellation email. Same physical event, different price tag.
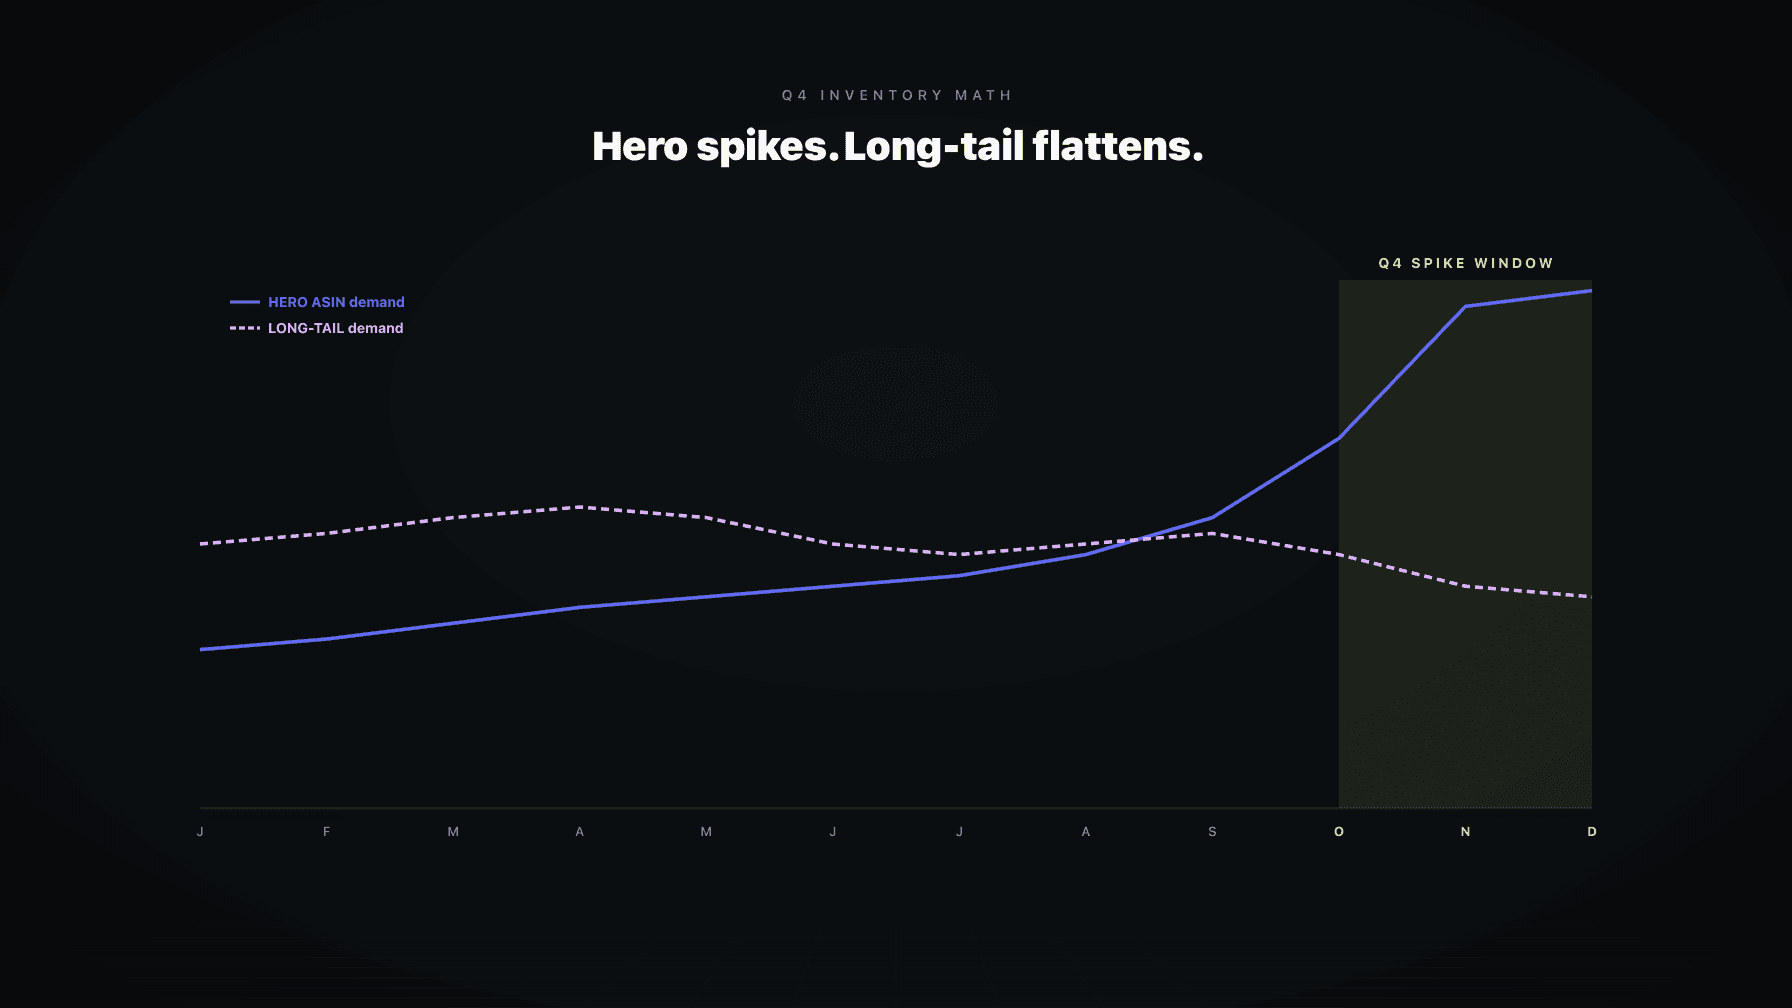
This is what every flat multiplier gets wrong.
Heroes spike harder than your average. They have the most deal exposure, external traffic, gifting use case, and search momentum. A category that grows 40 percent year-over-year will have heroes growing 80 to 200 percent.
Long-tail flattens in Q4. Not on the gift list. The replenishment SKUs that buyers buy in March, June, and October at the same rate. Q4 might lift them 10 to 30 percent from general site traffic. They do not need a hero multiplier.
Apply 1.6x across the catalog and heroes get 1.6x when they need 2.5x or 3x. They stock out. Long-tail gets 1.6x when it needs 1.15x. The excess sits in FBA past January, pays long-term storage in February, gets discounted in April. The carrying cost of the long-tail over-order is often larger than the lost margin of the hero under-order. But the hero is the visible problem, so that is what gets blamed.
Tier the catalog before you forecast. Apply different multipliers and safety stock per tier. Heroes get the most attention and the longest lead-time buffer. Long-tail gets the least.
The Q4 forecast does not start in October. It starts in May. Lead times do not allow anything else.
In May, you pull last year's Q4 actuals at the ASIN level. Not category level. ASIN level. Separate the SKUs that spiked from the SKUs that did not. Note which got deal placements. Note which stocked out and were therefore artificially capped on the upside. A stocked-out SKU's actuals are not its true demand. Estimate the run rate that would have been, or your next forecast inherits the cap.
In June and July, recalibrate against year-to-date performance. If a SKU is trending 1.4x year-over-year through June, the Q4 multiplier sits on top of that. The base has already moved.
In August, lock the first wave of orders for September landing and early-October availability. Hero SKU quantities first. Long-tail can wait for the second wave.
In September, recalibrate once more using August actuals. Adjust the late-October and mid-November orders. The September orders are already in transit.
In October, the forecast is locked. You are managing reorder timing for the FBM safety net and watching the SnS signal on SKUs you cannot afford to disappoint.
For brands sourcing overseas, the August window is the most important calendar block of Q4. Miss it and the rest of the plan compensates with FBM, expedited freight, or stockouts.
The timing math. 30 days production, plus 25 to 30 days ocean freight, plus 7 to 14 days FBA receiving, equals 65 to 75 days from PO to FBA-available. Hero inventory live October 1 requires PO confirmation by late July. Second-wave inventory live November 1 requires PO confirmation by mid-August. Anything booked after Labor Day risks landing late.
These windows are not suggestions. Container space tightens through September. Carrier rates rise. FBA receiving lengthens. A PO confirmed two weeks late can land three weeks late because every downstream step slips with it.
You do not order Q4 inventory all at once. Wave one lands by October 1. Wave two by November 1. Wave three is FBM safety reserve at the 3PL, ready to ship direct if FBA runs short during Black Friday.
Subscribe and Save is the part of Q4 inventory planning that almost nobody plans for, and it produces the most expensive form of stockout.
SnS customers have a delivery date scheduled. If you are out of stock on their ship date, Amazon either skips the delivery or cancels the subscription. They do not get a backorder. They get a cancellation email. Roughly 20 to 35 percent of canceled SnS subscriptions do not reactivate.
In Q4, the SnS ship dates are already locked. Customers signed up in July, September, October. They expect deliveries in November, December, January. If your hero ASIN runs out on November 22 because the Black Friday Lightning Deal drained the buffer, the SnS deliveries scheduled for November 24 through 30 are at risk.
Reserve SnS inventory separately from the deal pool. Take SnS run rate per SKU, multiply by ship days in the at-risk window, add a buffer. That quantity is not available for Lightning Deals, promotional pulls, or overflow. It is held back.
This is why you cannot evaluate Q4 inventory only against Q4 sales. Evaluate it against Q4 sales plus Q1 SnS deliveries. A November stockout that breaks SnS is a January revenue loss that does not show up in the Q4 P&L.
When you commit to a Lightning Deal or Best Deal, you promise Amazon a quantity at a price for a window. Run out mid-deal, the deal gets suppressed. Inventory at the 3PL instead of in FBA on deal day, the deal does not start. The penalty is not just lost sales of that window. It is the algorithmic memory of under-delivery that affects future placements.
A Lightning Deal expects roughly 3x to 8x your normal daily velocity in a four-hour window. A Best Deal runs for a week and expects 1.5x to 3x daily. Whatever multiplier you assume, the inventory has to be physically in FBA, receivable, and assigned to the offer at least 7 to 10 days before deal start. November deals need inventory landed by late October.
A defensible Q4 deal plan does three things. Commit inventory quantities to each deal slot before the calendar is locked. Carry a buffer above the deal commitment, sized to one day of post-deal velocity, so price-drop momentum does not stock you out the day after. Keep an FBM fallback at the 3PL in case FBA runs short before replenishment lands.
The brands that win deal placements in 2026 are not the ones with the lowest prices. They are the ones whose Q3 fulfillment metrics signaled to Amazon that the brand could ship the volume. That signal is earned in August and September, before the deal calendar opens.
Treat the Black Friday to Cyber Monday window as four separate demand events, not one rolling event. The mistake is averaging them.
Black Friday, November 27, 2026, is a search-and-deal day. Demand concentrates on SKUs with active deals and heavily-searched gift categories. Hero ASINs with deal placements can do 4x to 8x their daily average. SKUs without placements lift more like 1.5x.
The Saturday and Sunday between BF and Cyber Monday are a different shape. Demand softens overall but stays elevated. This is the rebuy window. Bundles and accessories move. The hero spike from Friday cools but does not collapse.
Cyber Monday, November 30, 2026, is a search-driven and self-purchase peak. Categories that index for self-purchase rather than gifting see their biggest day here. The exhausted operator who assumed the worst was over on Saturday is staring at a Monday morning that breaks safety stock.
Sum expected demand across all four days, add a Lightning-Deal-day buffer, add a Cyber Monday peak buffer. That is the minimum in FBA on November 23. Anything sitting at the 3PL waiting to ship in is not available, because FBA cannot receive and shelve fast enough that week to backfill a stockout.
December 26 through 31 is the most underread signal of Q4. Operators are exhausted. Dashboards are not getting checked. And the data generated in those six days tells you almost everything about Q1.
Demand drops sharply on December 25 and 26. On most SKUs it does not return to October levels until mid-January. The shape of the drop is the signal. If a SKU's December 26 velocity is still 1.5x its October baseline, that SKU has post-holiday momentum and belongs in a Q1 hero tier. If it drops to 0.7x its October baseline, it was a pure holiday SKU and your Q1 plan should de-rate it.
The same window tells you what to do with overstock. If long-tail inventory is sitting on December 28 with 90 days of cover, holding to spring is usually wrong. The carrying cost, plus February 15 long-term storage fees, plus the opportunity cost of cash in slow stock, almost always exceeds the margin you would recover. Markdown decisions are easier on December 28 than on March 1.
This is also where you catch the asymmetric forecast errors. The SKUs you over-ordered are visible now. The SKUs you under-ordered have been visible since November 15. Look at both, attribute the error to a forecasting assumption, and adjust the 2027 plan in writing before the team forgets.
You will under-order something. Probably one or two SKUs that surprised you. The question is what you do in the second week of October when you realize it.
The instinct is to expedite air freight. Sometimes that is right. The math has to clear. Air freight on a $25 retail unit at 30 percent margin probably does not pay back. Air freight on a $90 retail unit at 45 percent margin often does. Run the math per SKU before authorizing.
The better fallback is FBM out of a 3PL or your own warehouse. Hold reserve quantity outside FBA from late September forward. If FBA on a hero SKU drops below 10 days of cover with three weeks left in the window, switch the SKU to FBM, fulfill from the 3PL, leave the listing live. You give up the Prime badge for that window. You keep the rank, the SnS deliveries, and the deal slot.
The trigger has to be set in advance. Not in a Slack thread on November 12. The reorder-point and FBM-flip logic should be configured before October, with a clear days-of-cover threshold per ASIN tier. When the threshold hits, the action is automatic.
The mirror problem to under-ordering is over-ordering, and it is more common than operators admit because the cost is hidden across multiple months instead of concentrated in one week.
The decision tree on January 5. Pull each over-ordered SKU. Calculate current days of cover at January velocity, not December velocity. Under 120 days, hold to spring at full price. 120 to 240 days, run a controlled markdown through late January and February to bring cover under 120 before February 15 long-term-storage fees. Over 240 days, markdown aggressively, run targeted PPC to move volume, consider removal orders on the deepest excess.
The mistake is holding everything to spring on the theory that the brand "does not discount." That theory loses money every February when storage fees compound. The other mistake is panicking on January 5 and marking down everything. That destroys margin on SKUs that did not need it.
Triage in the first week of January, commit to a markdown calendar, stick to it. The decision is easier when you make it once, in writing, with the numbers in front of you.
Bruno is the Profasee AI employee for demand planning. In Q4, Bruno does the per-tier forecasting work the static models cannot do. Heroes get their own multiplier, safety stock, and reorder windows. Long-tail gets treated separately. The output is a tiered Q4 plan with reorder dates, deal-window commitments, FBM fallback triggers, and SnS reservations sized per SKU. More on how this is built in the demand planner overview and the inventory management solution.
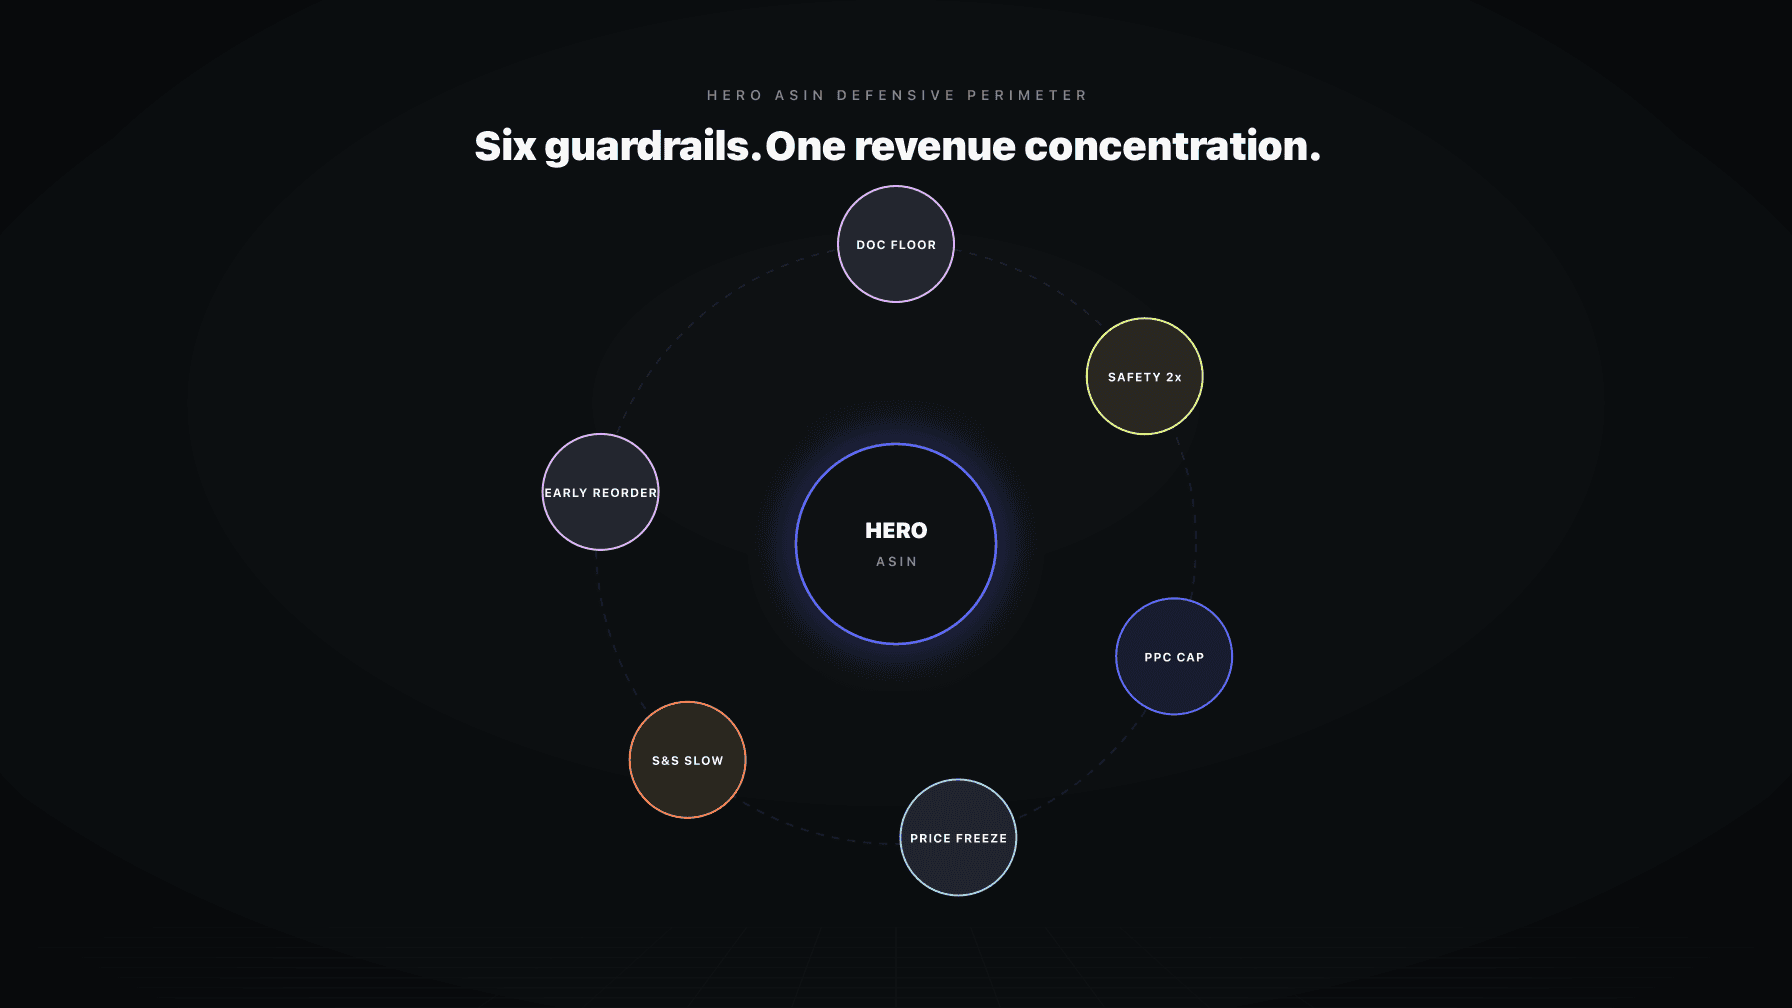
Bruno does not operate alone. The Q4 plan is coordinated with Marko (PPC) and Oracle (pricing). When Bruno flags a SKU as stockout-risk on November 14, Marko pulls back PPC bids so the brand stops paying for clicks on inventory that will not exist by November 21. Oracle freezes the price floor on the same SKU so the repricer does not chase a competitor down on a SKU about to disappear from FBA. This is the coordination loop in velocity-aware pricing applied to Q4.
Q4 is not the time to run pricing, PPC, and inventory as three independent systems. The cost of a missed signal is too high. Bruno, Marko, and Oracle share the same forecast and inventory state, and actions stay coordinated through the holiday window. If that is the operating posture you want for Q4 2026, apply to work with us.
Start in May with last-year actuals at the ASIN level, separated into hero, mid-velocity, and long-tail tiers. Each tier gets its own multiplier and safety stock target. Lock wave one in early August for September landing, wave two by mid-August for November landing, and hold a third wave at a 3PL as FBM reserve. Recalibrate in September, then keep the plan locked through October.
For overseas sourcing, heroes that need to be in FBA by November 1 require PO confirmation by mid-August. Production takes about 30 days, ocean freight 25 to 30, FBA receiving 7 to 14 (the window stretches in November). Any PO confirmed after Labor Day for November landing is at material risk. Domestic sourcing buys four to six weeks back on those dates.
Hero ASINs should cover the largest expected single-day deal spike, plus one day of post-deal velocity, plus SnS deliveries scheduled in the at-risk window. In practice that is often 2x to 3x normal safety stock through November and early December. Long-tail ASINs do not need elevated safety stock.
There is no single multiplier, and that is the point. Heroes typically need 2x to 4x over baseline. Long-tail typically needs 1.1x to 1.3x. Mid-velocity sits in the middle. A flat 1.5x or 1.7x under-orders heroes and over-orders long-tail at the same time. Tier the catalog before you forecast.
Reserve SnS inventory separately from the deal pool. Take SnS run rate per SKU, multiply by ship days in the at-risk window, add a buffer, hold it back. If the SKU still trips toward stockout, switch SnS-eligible inventory to FBM before the FBA buffer fully drains. A canceled SnS subscription rarely reactivates without manual intervention.
Triage in the first week of January. Under 120 days of cover at January velocity, hold at full price. 120 to 240, run a controlled markdown calendar through January and February to clear before February 15 long-term-storage fees. Over 240, mark down aggressively, support with PPC, and consider removal orders on the deepest excess.
Only if it is built to. A generic AI forecast that treats all ASINs the same reproduces the uniform-multiplier mistake that breaks Q4 plans. The forecast has to be tiered by ASIN, aware of deal commitments, coordinated with pricing and PPC, and connected to SnS run rates and FBA receiving timelines. Bruno is built for this, and the coordination with Marko and Oracle is what keeps actions consistent through the holiday window.