Chad Rubin
May 12, 2026 · 12 min read
Operator notes by email
Short, opinionated takes on AI agents, Amazon PPC, pricing, and inventory. No fluff. About once a week.
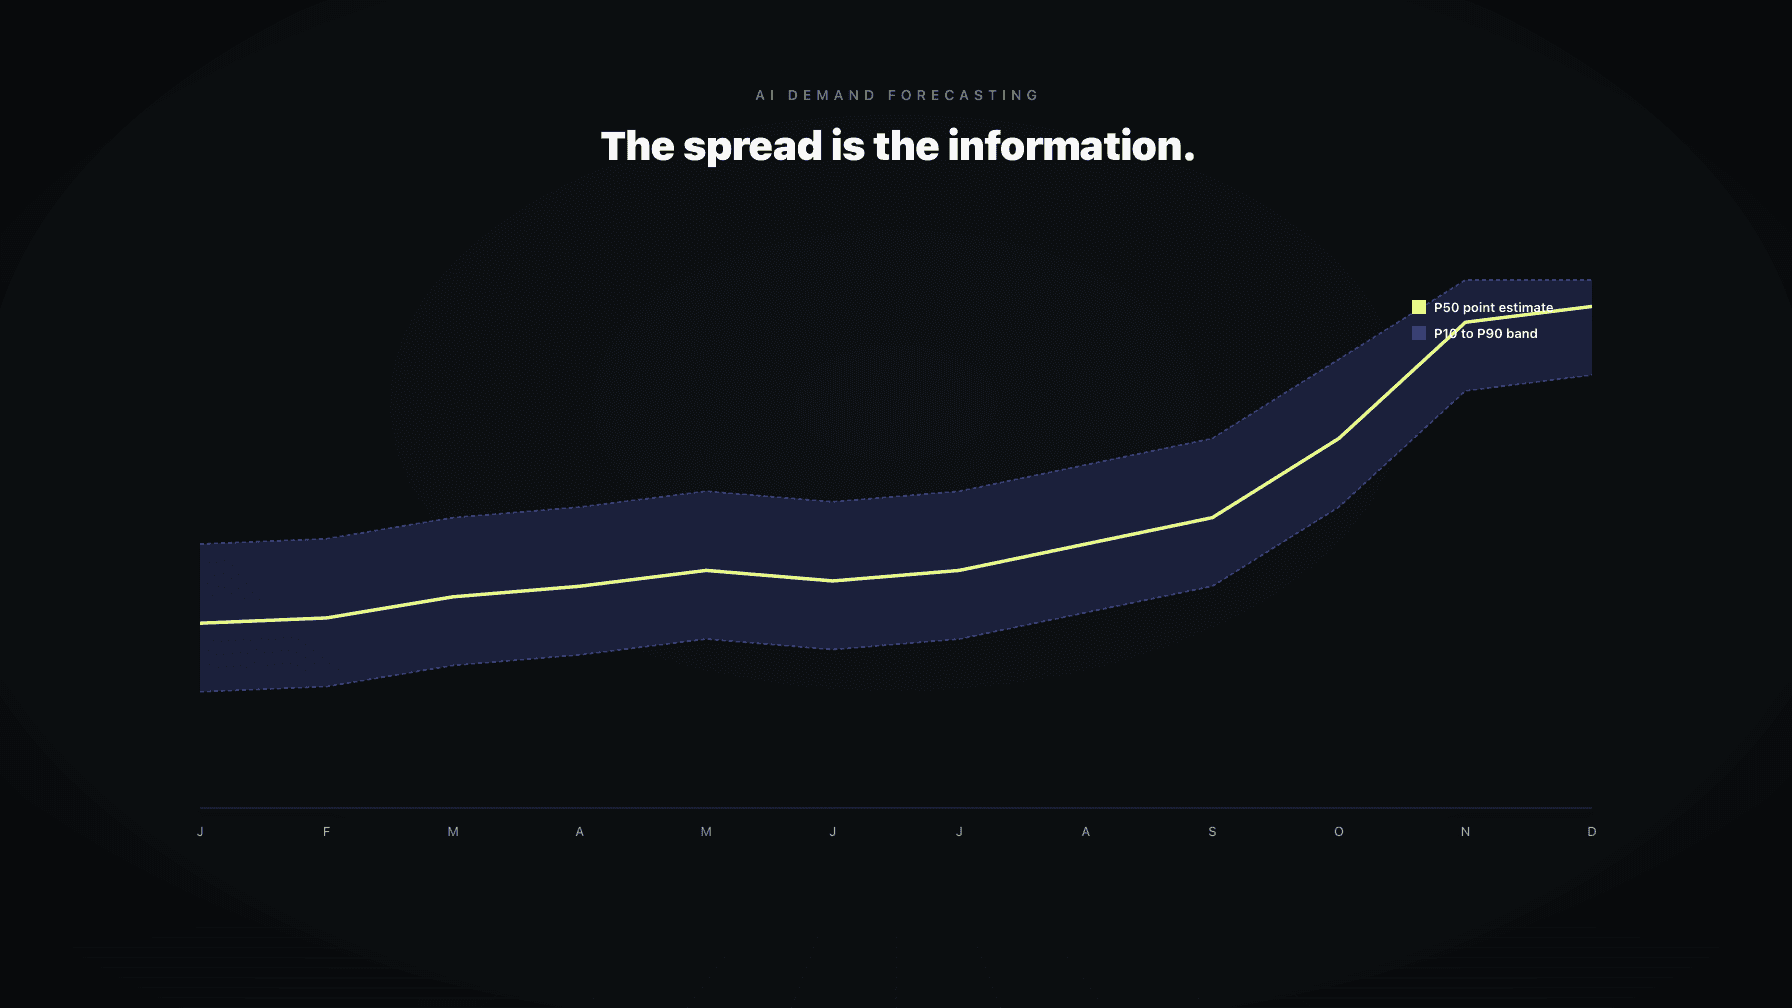
Most operators read a forecast like it is a fact. The tool says you will sell 1,240 units next month, so you reorder against 1,240. Then real life shows up. You sell 980, or 1,610, and the planner blames the model. The model was not wrong. The number you were reading was not the forecast. It was the middle of the forecast.
Real demand forecasting does not produce a number. It produces a distribution. The center is what tools show you on the dashboard because a single number is easy to render. The spread is where the operating decisions actually live. If you ignore the spread, you are running inventory on a coin flip dressed up in a chart.
I ran a 7-figure Amazon brand for a decade before building Profasee. The forecasting mistakes I made early on were not because the math was wrong. They were because I read every forecast as a promise instead of a probability. AI demand forecasting tools today are dramatically better than what I had access to, and dramatically easier to misread, because the wrong number now looks more confident.
This post is the operator's guide to reading a probabilistic forecast. What the confidence interval actually represents, how to size safety stock against it, and how to spot a model that is lying about how sure it is.
## Key takeaways >- A demand forecast is a distribution, not a number. The point estimate hides the operating risk.- A confidence interval is a range and a probability. P80 means there is an 80 percent chance demand lands inside the band.- Safety stock should be sized off the upper bound at your chosen service level, not off the average.- High-variance ASINs need wider bands and more buffer. Forcing tight forecasts on noisy SKUs guarantees stockouts.- Stable SKUs deserve tighter bands and less buffer. Treating them like volatile SKUs ties up cash.- Overconfident forecasts and underconfident forecasts both fail. Calibration matters as much as accuracy.- Good AI demand forecasting software shows you the band, the percentiles, and the calibration history, not just the line.
A point estimate is one number. "You will sell 1,240 units in May." It is the mean or median of the underlying distribution. It is the cleanest possible output, which is exactly why it is the most dangerous one.
Two ASINs can share a point estimate of 1,240 and behave nothing like each other. The first might have a true range of 1,180 to 1,300 with 80 percent probability. The second might have a true range of 720 to 1,760 with 80 percent probability. Same midpoint. Wildly different inventory decisions.
Order 1,240 units for both, and the first lands within a few percent of plan. The second either stocks out or sits on three months of dead inventory. The model knew the second ASIN was riskier. The dashboard just did not show you that part. The summary throws away the information you actually need to make a reorder decision.
From reading to action
If the framework above sounds familiar, your Amazon account is probably carrying the same drag. Apply and we will show what Marko, Oracle, and Bruno would change in your first week.

Ran a 7-figure Amazon brand for a decade. Founded Skubana (acquired). Co-founded Prosper Show. 15+ years on Amazon.
Join the brands that replaced agencies and tools with AI employees.
A confidence interval is a range plus a probability statement. "Between 1,050 and 1,430 units with 80 percent confidence" is a forecast. It tells you two things at once: where demand is likely to land, and how sure the model is.
The probability is the part most operators read wrong. An 80 percent confidence interval does not mean the forecast is 80 percent accurate. It means that if the model is well calibrated, demand should fall inside the band 80 percent of the time and outside the band 20 percent of the time. Five out of every five forecasts will not be perfect. One out of every five should be outside the band on purpose. That is what 80 percent confidence is.
If your forecasts are inside the band 100 percent of the time, the model is underconfident. The band is too wide. You are buying too much safety stock. If your forecasts are inside the band 50 percent of the time when the model claims 80 percent confidence, the model is overconfident. The band is too tight. You are stocking out more than you should.
The probability statement is a promise the model is making about its own reliability. Good AI demand forecasting software measures whether that promise holds. Most operators never check.
You do not need to know the equations. You do need to know what the model is doing.
A probabilistic forecast estimates a probability density over future demand. For every possible sales number next month, the model assigns a likelihood. Selling between 1,200 and 1,280 might have a 30 percent likelihood. Selling more than 1,800 might have a 2 percent likelihood. Add up all the likelihoods across all possible outcomes and you get a curve.
The curve has a shape. For most well-behaved Amazon ASINs, it is roughly bell-like. For ASINs with promotional spikes or viral moments, the curve gets skewed. The right tail runs longer than the left, because demand can blow up more than it can collapse (you cannot sell less than zero).
The confidence interval is a slice of that curve. The P80 band contains 80 percent of the probability mass. The P95 band is wider because it contains 95 percent. Three things determine the width: historical variance for the ASIN, the model's certainty about current conditions, and the time horizon. Forecasting next week is tighter than forecasting next quarter.
The honest answer is "several different ways, and the method matters."
The simplest approach fits a single point-estimate model, measures its historical errors, and draws the band at plus or minus some multiple of the error. Fast and roughly fine for stable SKUs. It fails when conditions change, because the historical error distribution stops describing the future.
A better approach is quantile regression. The model is trained to predict the P10, P50, P90 quantiles directly. It handles asymmetric distributions correctly, which matters for promotional or seasonal demand.
The current state of the art is probabilistic deep learning. Models like DeepAR, Temporal Fusion Transformer, and probabilistic boosted trees predict a full distribution per ASIN per time step. They encode price, promotion, day of week, lead time, and competitive context as features and propagate uncertainty into the band.
Technique matters less than calibration. A simple model that is calibrated beats a sophisticated model that is overconfident. Ask any AI demand forecasting tool you evaluate to show you a calibration plot: predicted confidence versus actual hit rate. If they cannot produce that chart, the bands are decorative.
The percentile language is just a way of asking the model how cautious you want to be.
P50 is the median. Half the time demand will land above it, half the time below. P50 is what you plan against if you are sizing average inventory turns or modeling baseline cash flow. It is not what you reorder against, because reordering at the median means you stock out half the time.
P80 is the 80th percentile. Demand will land at or below this number 80 percent of the time. Reorder against P80 and you carry enough stock to cover most months. The 20 percent of months that exceed P80 are where stockouts can happen unless you have a buffer. Most non-critical ASINs operate at P80 or P85.
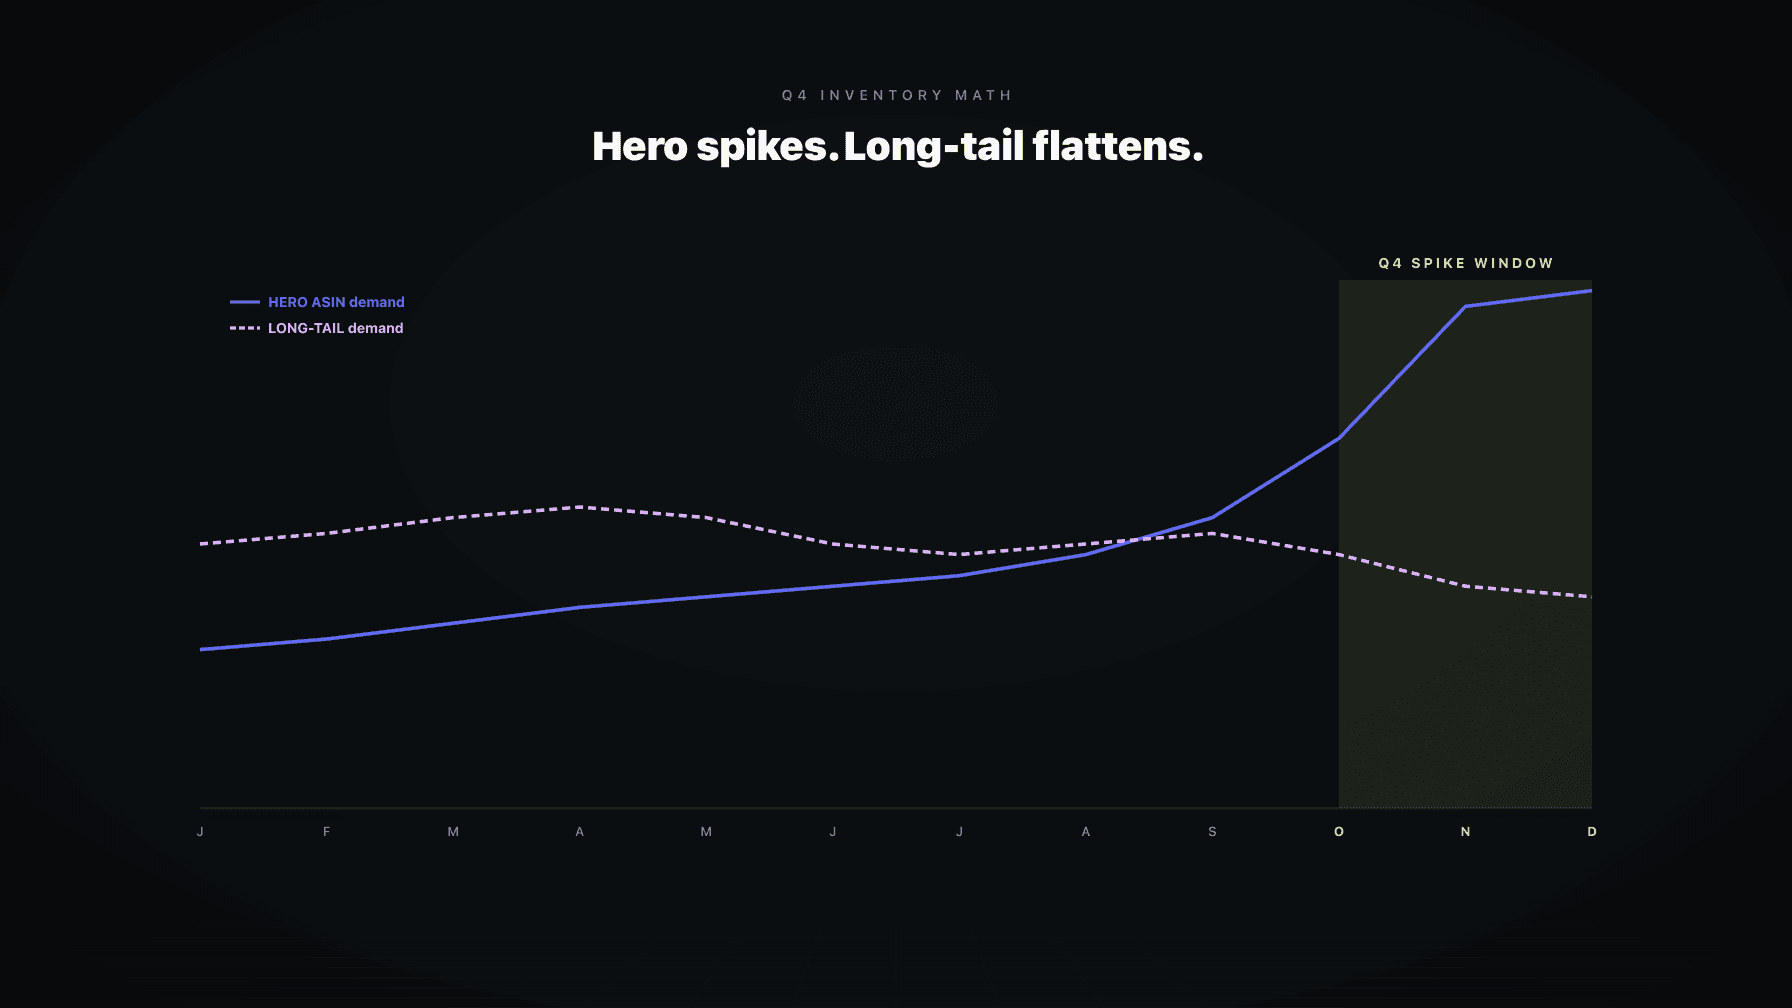
P95 is the 95th percentile. Demand will land at or below this number 95 percent of the time. P95 is what you reorder against for hero ASINs, for any SKU where a stockout cascades into ranking and review damage, and for the run-up to Q4. The cost of carrying extra inventory is small compared to the cost of being out of stock on your top earner.
The trade-off is real. P50 ties up the least cash and stocks out the most. P95 ties up the most cash and stocks out the least. There is no "right" answer across the catalog. Different ASINs deserve different service levels based on margin, recovery cost, and substitutability.
Here is where the operating decision lives. Most planners size safety stock as a flat number of days, say 14 days of average sales, applied identically across the catalog. That ignores everything the model knows about variance.
The right way to size safety stock is from the interval itself. Pick a service level (P80, P90, P95) based on the ASIN's importance. Read the upper bound of that confidence interval over your lead time plus review period. The difference between that upper bound and the mean expected demand is your safety stock.
A stable SKU with a tight band might need only a few days of buffer to hit P95, because the model is confident demand will not swing much. A volatile SKU with a wide band might need three or four weeks of buffer at the same P95 service level, because the model is honestly telling you it does not know. Same service level, very different stock positions. That is how it should look.
If your inventory planning tool sizes safety stock as a flat number for every ASIN, it is not using the probabilistic information the forecast contains. It is averaging away the entire point. For a deeper walkthrough of the arithmetic, see days of cover, reorder point, and safety stock.
Some ASINs just have noisy demand. New launches, fashion-adjacent items, seasonal products outside their season, anything with viral exposure on TikTok or Reels, anything where competitor pricing swings unpredictably. The forecast will come with a wide band. Sometimes the upper bound is 3x the lower bound.
The instinct is to distrust the model and override it with a gut estimate. Resist that. A wide band is the model being honest. Plan for the width, do not pretend it is not there.
Three moves work on high-variance ASINs. First, run higher service levels (P90 or P95) so the safety stock catches the upside. Second, reorder more frequently in smaller batches, so the forecast horizon stays short and the band stays as tight as it can. Third, accept that some of these ASINs will end up overstocked or stocked out occasionally, and price-manage your way out using markdown rules or velocity-aware pricing.
For hero ASINs specifically, stockout prevention beats inventory efficiency every time. The math is in stockout prevention for hero ASINs.
The opposite case gets handled wrong in the other direction. A mature SKU with years of clean sales, no seasonality, and no promotional history will produce a tight band. P80 might be within 5 percent of P50.
The temptation is to treat tightness as license to run lean. That is correct on average and dangerous in detail. A tight band assumes conditions stay the way they have been. Amazon does not always cooperate. A new competitor launches, a category review goes sideways, a fulfillment center changes regions, and your stable SKU is suddenly not stable.
Use the tight band for inventory efficiency while monitoring for regime change. The moment recent forecasts start missing in the same direction three or four weeks running, the underlying conditions have shifted and the band needs to widen. Good demand forecasting software flags this. Bad software keeps drawing a tight band against a moving target.
Calibration is the single most underrated diagnostic in demand forecasting. Most operators never look at it because the dashboards do not show it. They should.
The check is simple. Take your last 12 weeks of P80 forecasts. Count how many times actual demand landed inside the band. If your P80 forecasts caught demand 9 or 10 weeks out of 12, the model is roughly calibrated. If they caught 12 out of 12, the model is underconfident and you are over-buffering. If they caught 6 out of 12, the model is overconfident and you are under-buffering.
You can run the same check at P95. A well-calibrated P95 should catch 11 or 12 out of 12. If P95 is missing more than that, the model has a systematic blind spot.
Three patterns predict overconfident forecasts. First, the model was trained on a stable period and the current environment is changing fast (think category-wide competitive shifts, fee structure changes, fulfillment region moves). Second, the model is not seeing key features like price, promotion, or inventory state, so it cannot reason about why demand might shift. Third, the model is a point-estimate model with a uniform error band slapped on after the fact, instead of a real probabilistic model.
The fix is not to widen every band arbitrarily. The fix is to use a model that updates its confidence based on conditions and to check the calibration plot every few weeks.
The minimum bar for AI demand forecasting software is not the forecast number. It is what surrounds the number.
A serious tool shows the point estimate, the confidence band at multiple percentiles, the calibration history, the features driving the forecast, and the override path. It tells you which ASINs are in stable regimes and which are volatile. It explains why a forecast moved week over week (price changed, promotion ran, competitor restocked). It separates baseline demand from promotional lift.
It also coordinates with the rest of the operation. A forecast in isolation is half a decision. The other half is pricing and PPC. If price drops, demand goes up and the forecast should reflect that. If PPC tightens, demand pulls in and the forecast should reflect that too. Tools that forecast in a silo produce numbers that get stale the moment something else moves. The systems view is in the AI operating system for Amazon brands and in the unified amazon inventory management playbook.
For Q4, where promotional density, lead time pressure, and stockout cost all compound, forecast quality directly determines profit. The Q4 inventory math post covers that compression.
Bruno is the demand planning AI employee inside Profasee. Bruno refuses to display only a point estimate. Every forecast comes with a confidence band, percentile breakdowns, and a calibration record. You see the P50, P80, P95, and the historical hit rate at each percentile for that ASIN. If the model has been overconfident on this SKU recently, Bruno tells you.
Bruno does not forecast in isolation. It coordinates with Oracle on pricing and with Marko on PPC. When Oracle moves price, Bruno's forecast shifts to reflect the elasticity. When Marko shifts spend, Bruno re-runs against the new demand inputs. The forecast on Monday is not the forecast on Friday if pricing or PPC moved.
Safety stock and reorder points get sized off the actual interval, not a flat days-of-cover assumption. Hero ASINs run at higher service levels. Long-tail SKUs run leaner. Volatile ASINs get wider buffers automatically. Bruno does the read and surfaces the recommendation, with the math visible.
The Profasee inventory management solution page covers the architecture. Pricing is on the pricing page, and you can apply here to see Bruno working against your own catalog.
AI demand forecasting uses machine learning models to predict future sales for Amazon ASINs based on historical sales, price, promotions, seasonality, lead time, and competitive context. Modern AI demand forecasting produces a probabilistic forecast (a distribution with a confidence interval) rather than a single number. The output is used to size purchase orders, reorder points, safety stock, and FBA send-in quantities.
Traditional planning uses moving averages or simple regression on historical sales and outputs a single point estimate. AI forecasting ingests many more features (price, PPC spend, promotional flags, lead times, competitor signals) and outputs a full probability distribution. The practical difference: traditional methods miss variance and either over-buffer everything or stock out on volatile SKUs. AI forecasting sizes the buffer per ASIN based on its actual demand uncertainty.
A confidence interval is a range plus a probability. An 80 percent confidence interval of 1,050 to 1,430 units means the model expects demand inside that range about 80 percent of the time. If the model is well calibrated, demand will land outside the band about 20 percent of the time at P80. That is by design, not a failure.
Pick a service level based on the ASIN's importance (P80 for typical SKUs, P95 for hero ASINs and Q4 critical SKUs). Read the upper bound of the confidence interval at that service level over your lead time plus review period. The difference between the upper bound and the mean expected demand is your safety stock. Stable SKUs get tight buffers automatically. Volatile SKUs get wide buffers automatically.
P80 is the 80th percentile of the demand distribution. Demand will land at or below the P80 number about 80 percent of the time. Reordering against P80 (rather than the median) gives you enough stock to cover most months while keeping inventory efficient. P95 is more conservative and is used for hero ASINs or critical seasonal SKUs.
Yes, if the model has seen enough seasonal history and has access to promotional and price features. AI demand forecasting handles Q4 better than traditional methods because it can separate baseline demand from promotional lift and widen its confidence interval to reflect the higher variance. The trap is forecasting Q4 from a one-year history or running a tool that does not include promotional inputs.
Run a calibration check. Pull the last 12 weeks of P80 forecasts and count how many times actual demand landed inside the band. A calibrated model catches 9 or 10 out of 12. If it caught 6 out of 12, the model is overconfident and your safety stock is undersized. If it caught all 12, the model is underconfident and you are over-buffering. Good AI demand forecasting software shows this calibration history automatically.