Chad Rubin
May 13, 2026 · 12 min read
Operator notes by email
Short, opinionated takes on AI agents, Amazon PPC, pricing, and inventory. No fluff. About once a week.
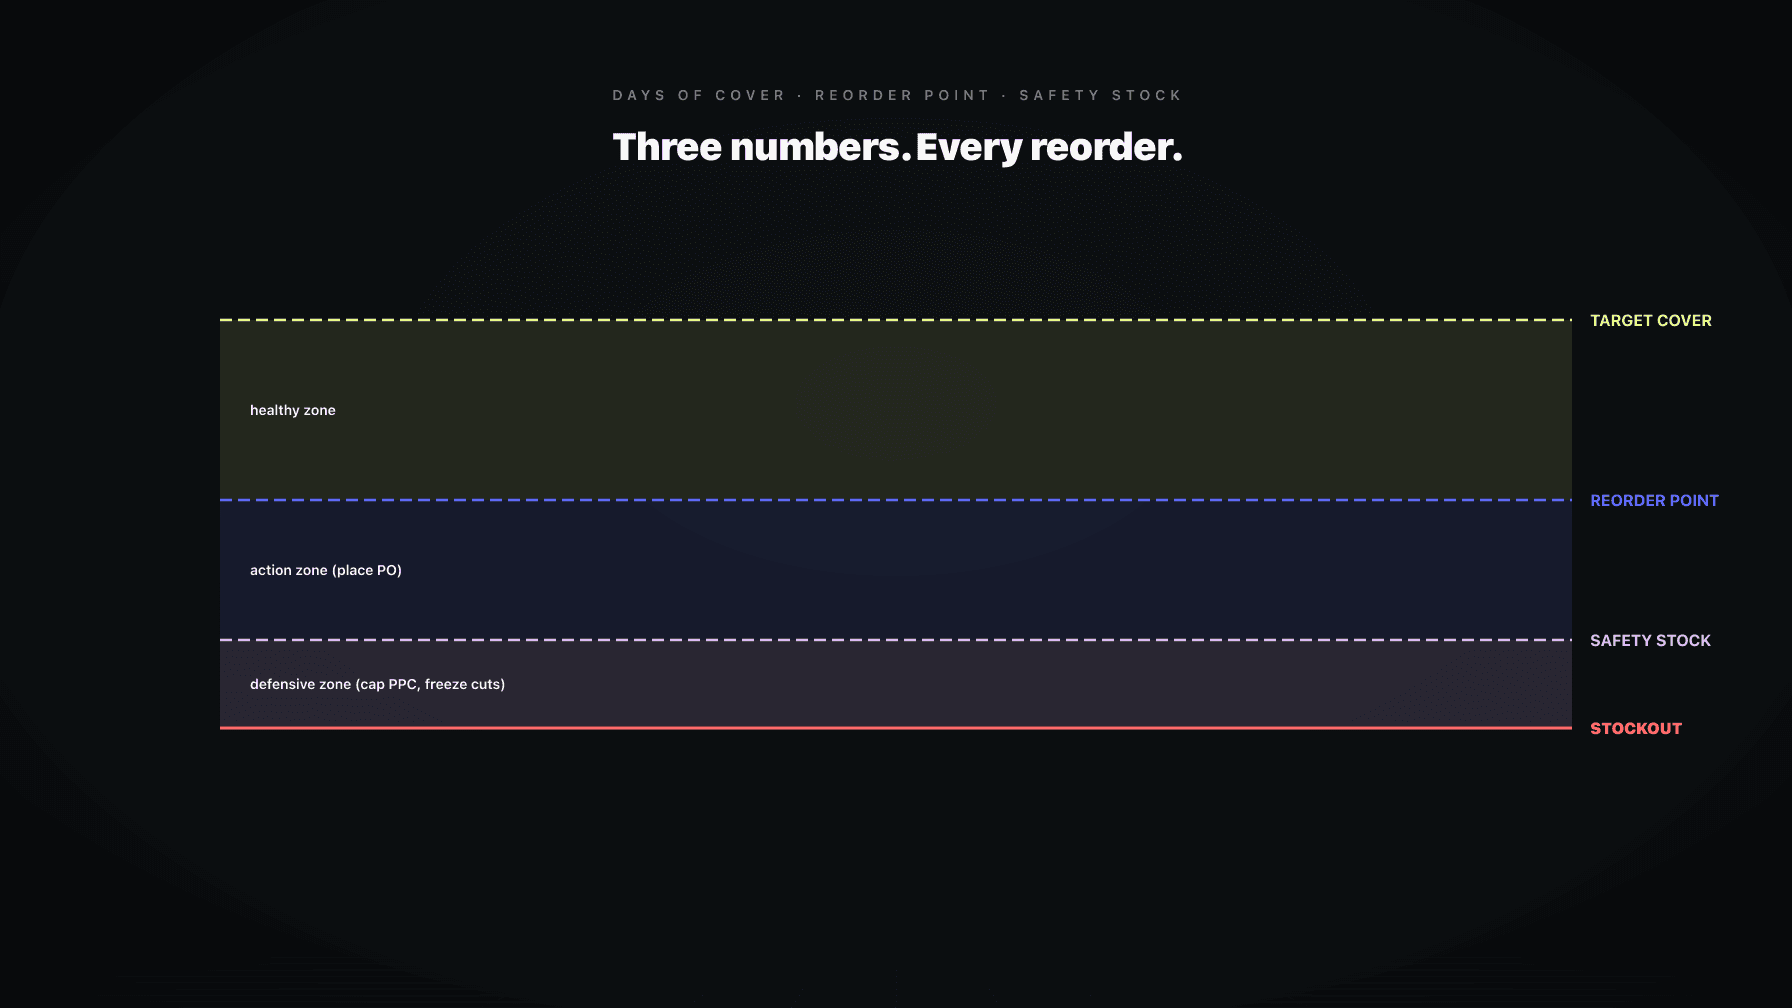
Most Amazon operators set three inventory numbers once, usually when they first stood up a forecasting tool or a 3PL relationship, and then forget about them for two or three years. Days of cover. Reorder point. Safety stock. Every reorder decision rolls up out of those three.
I have watched operators run multimillion dollar catalogs against numbers set during a different freight environment, a different velocity profile, and a different cost of capital. The brand grows. Velocity shifts. Tariffs move. Lead times stretch. The numbers stay frozen.
This is a problem before you add an AI agent. With an AI agent in the loop, it becomes the problem. The agent executes against whatever floor you set. If your reorder point is wrong, the agent reorders at the wrong moment with full confidence. If your safety stock is undersized, the agent looks like a genius until the first lead-time slippage, and then it looks catastrophic.
This post is the operator math. Three numbers, three worked examples, a quarterly review cadence.
The Amazon seller world has spent two years arguing about AI features. Better forecasting. Better repricing. Better PPC bidding. All of it matters. None of it matters more than the floor.
Days of cover, reorder point, and safety stock are the floor. They define the rules the AI is allowed to play inside. They are the difference between "the agent ordered 4,000 units at the right moment" and "the agent ordered 4,000 units six weeks too early and now you are paying long-term storage fees on a slow mover."
The painful part is that operators tend to grade the driver, not the road. They will swap forecasting tools three times before they question whether their reorder point is right. The three numbers interact: set days of cover too high and you over-order, set reorder point too low and you stock out, set safety stock too high and you carry dead capital, set safety stock too low and a single supplier slip wipes out a Buy Box win. Getting these right is the actual operator job.
From reading to action
If the framework above sounds familiar, your Amazon account is probably carrying the same drag. Apply and we will show what Marko, Oracle, and Bruno would change in your first week.

Ran a 7-figure Amazon brand for a decade. Founded Skubana (acquired). Co-founded Prosper Show. 15+ years on Amazon.
Join the brands that replaced agencies and tools with AI employees.
Days of cover is the answer to one question: at today's sales velocity, how many days until I run out?
The formula is simple.
Days of cover = current on-hand units / daily sales velocity
If you have 1,800 units on hand and you sell 30 per day, you have 60 days of cover. That is it. It is a snapshot in time, computed from a snapshot of inventory and a snapshot of velocity.
The mistakes operators make with days of cover:
Days of cover is the thermometer. It tells you the temperature. It does not prescribe medicine.
Numbers on it. Illustrative, not from a real account.
Assume:
Naive days of cover: 1,500 / 30 = 50 days.
Including in-transit: (1,500 + 600) / 30 = 70 days.
Which number do you act on? Depends on the decision. If you are asking "do I need to expedite," the naive number matters more, because in-transit cannot save you if the fire drill is today. If you are asking "do I need to place a new PO," the in-transit number matters more, because the new PO will not arrive for weeks anyway.
Days of cover is a category of metric, not a single number. A good dashboard shows FBA-only, FBA-plus-in-transit, and all-units-including-reserve. Each answers a different operator question.
Reorder point is the trigger. It is the number where you say "place the next PO now."
The formula:
Reorder point = (average daily sales x lead time in days) + safety stock
In plain operator language: how many units will I sell during the time it takes the supplier to ship and the freight to land, plus a buffer for things going wrong.
Two things break this formula in practice.
First, operators use average lead time. Average lead time assumes everything goes right: customs smooth, factory on date, freight forwarder has space, FBA receive does not sit on the load. Real lead-time distributions have a long right tail. Set reorder point at average lead time and you stock out roughly half the time, by definition.
Second, operators bundle safety stock into the lead-time figure. They say "lead time is 60 days" but mean "45 days plus a 15-day cushion." Fine as a back-of-envelope, but the buffer is impossible to tune when it is hidden inside the lead-time number.
The cleaner version:
Reorder point = (daily velocity x 95th-percentile lead time) + safety stock for demand variance
Lead-time risk and demand risk stay as separate, tunable knobs. You will thank yourself in eight months when freight rates move and you need to update one number without re-deriving the whole spreadsheet.
Most operators have one lead-time number per supplier. That is wrong. They need two, at minimum: the average and the 95th percentile.
The 95th percentile is the lead time you beat 95 percent of the time. It is the bad case, not the disaster case. It is the number you should usually plan against.
Why not the average? Because at the average, by definition, half of your shipments arrive later. Plan reorders at the average and you stock out roughly half the time during the lead-time window. That is the math, not bad luck.
Why not the 99th percentile? Because it is so rare that planning against it ties up enormous capital. The trade:
How do you find the 95th percentile? Pull the last twelve PO landings. Sort by total elapsed days from PO to FBA receive. The value worse than 95 percent of the others is your number. With fewer than twelve POs, use the worst case you have seen and revise as data comes in.
Lead-time variance is not constant. Q4 freight is slower than April freight. Tariff regimes shift it. Carrier strikes shift it. The number you computed last summer is probably wrong now.
A more realistic scenario. Illustrative numbers.
Assume:
Naive reorder point: 80 x 21 = 1,680 units, plus 7 days of safety stock at 80 per day (560 units) equals 2,240.
Wrong two ways. One, 21 days is the average; the 95th percentile is 35. 80 x 35 = 2,800. Two, trailing velocity is the wrong velocity. The ASIN is heading into June, where forecast is 140 per day. 140 x 35 = 4,900. Add safety stock for demand variance (calculated in the next example) and reorder point lands closer to 5,500 to 6,000 units.
The gap between the naive answer (2,240) and the right answer (5,500 plus) is the stockout window. An operator running the naive math reorders too late, the PO lands into a hot June, and the ASIN is out of stock during peak. Lost sales, lost rank, lost momentum. An AI agent will not catch this unless the underlying numbers are right. The agent is not the problem. The floor is.
Safety stock is the buffer. It exists because the real world is variable.
Two sources of variance:
The naive operator buffer is "two weeks of inventory." Fine as a starting heuristic, but it does not distinguish between an ASIN with stable demand and reliable lead times (where two weeks is overkill) and an ASIN with volatile demand and unreliable lead times (where two weeks is dangerous).
The operations-research version:
Safety stock = Z x sqrt((lead time x demand standard deviation squared) + (average demand squared x lead-time standard deviation squared))
Z is a service-level multiplier. For 90 percent service, Z is about 1.28. For 95 percent, 1.65. For 99 percent, 2.33.
It looks intimidating but it just combines two variances. More demand variance pushes the buffer up, more lead-time variance pushes the buffer up, the service level scales the whole thing. The operator decisions inside the formula are the service-level target (different per ASIN) and the measured standard deviations of demand and lead time (pulled from trailing data). If you cannot answer those for your top 20 ASINs, you are running on heuristic.
Same seasonal ASIN. Illustrative.
Demand-side variance: 21 x (18 x 18) = 6,804 Lead-time-side variance: (140 x 140) x (7 x 7) = 960,400 Total variance: 967,204 Standard deviation: sqrt(967,204) is about 983 Safety stock at 90 percent: 1.28 x 983 = about 1,258 units.
Two takeaways.
First, the lead-time variance term (960,400) dominates the demand variance term (6,804) by two orders of magnitude. Lead-time risk is the bigger risk on this ASIN. The highest-leverage operator move is not better demand forecasting. It is tightening lead-time variance, finding a faster supplier, or pre-positioning at a 3PL.
Second, bump service level from 90 to 99 percent and Z goes from 1.28 to 2.33. Safety stock goes from 1,260 to 2,290. You almost double the buffer to cover the worst 9 percent of cycles. Worth it depends on margin and cost of capital. For a hero ASIN with high margin, usually yes. For a $14 long-tail SKU with 11 percent contribution margin, almost never. Operator decision. Software makes the math visible.
Not every ASIN deserves the same level of inventory rigor. The math is the same. The inputs and the chosen service levels should be different.
A useful three-tier model:
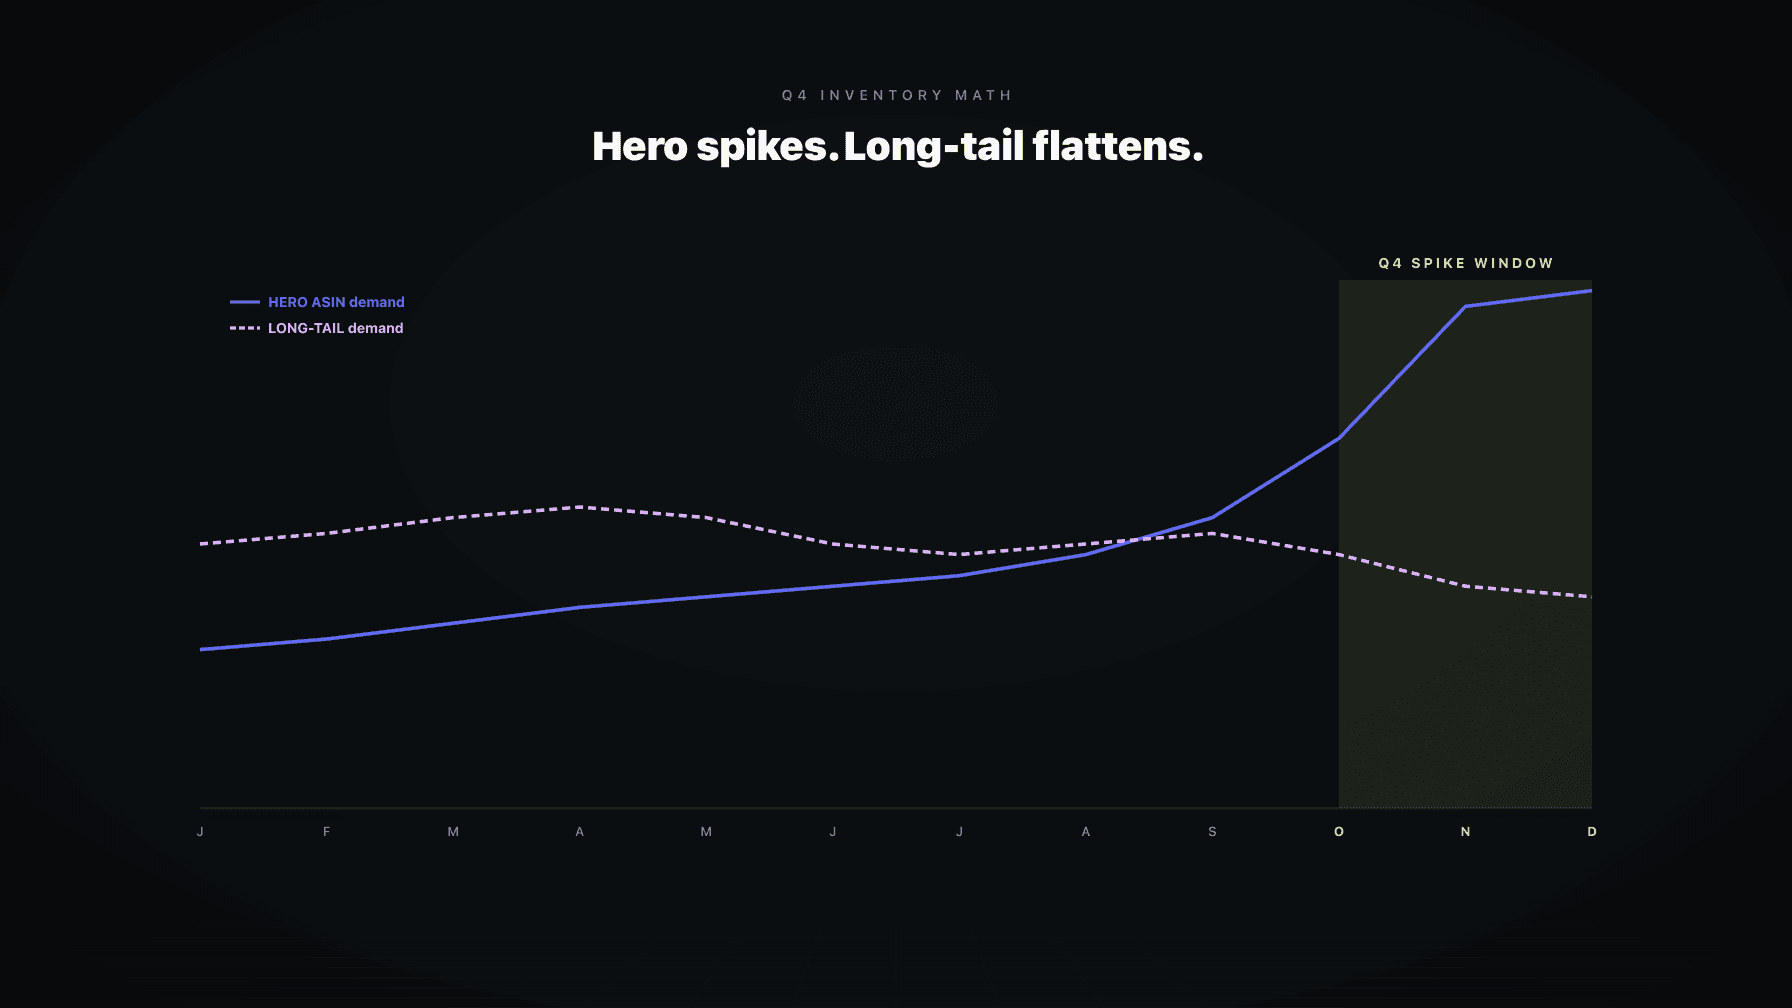
Hero ASINs. Top 10 to 20 SKUs that drive the majority of revenue. Service level 97 to 99 percent. Reorder point planned to 95th-percentile lead time. Safety stock fully computed from variance. Days of cover reviewed weekly, daily during peak. A single stockout costs rank and review velocity, and that compounds for months.
Mid-tier ASINs. Solid contributors, not catalog-defining. Service level 92 to 95 percent. Reorder point at 90th-percentile lead time. Demand-variance-only safety stock is fine. Review monthly.
Long-tail ASINs. Bottom half by revenue. Service level 85 to 90 percent. Reorder point at average lead time with a heuristic buffer. Safety stock heuristic (two weeks of cover). Review quarterly. Honest truth: some of these should be cut.
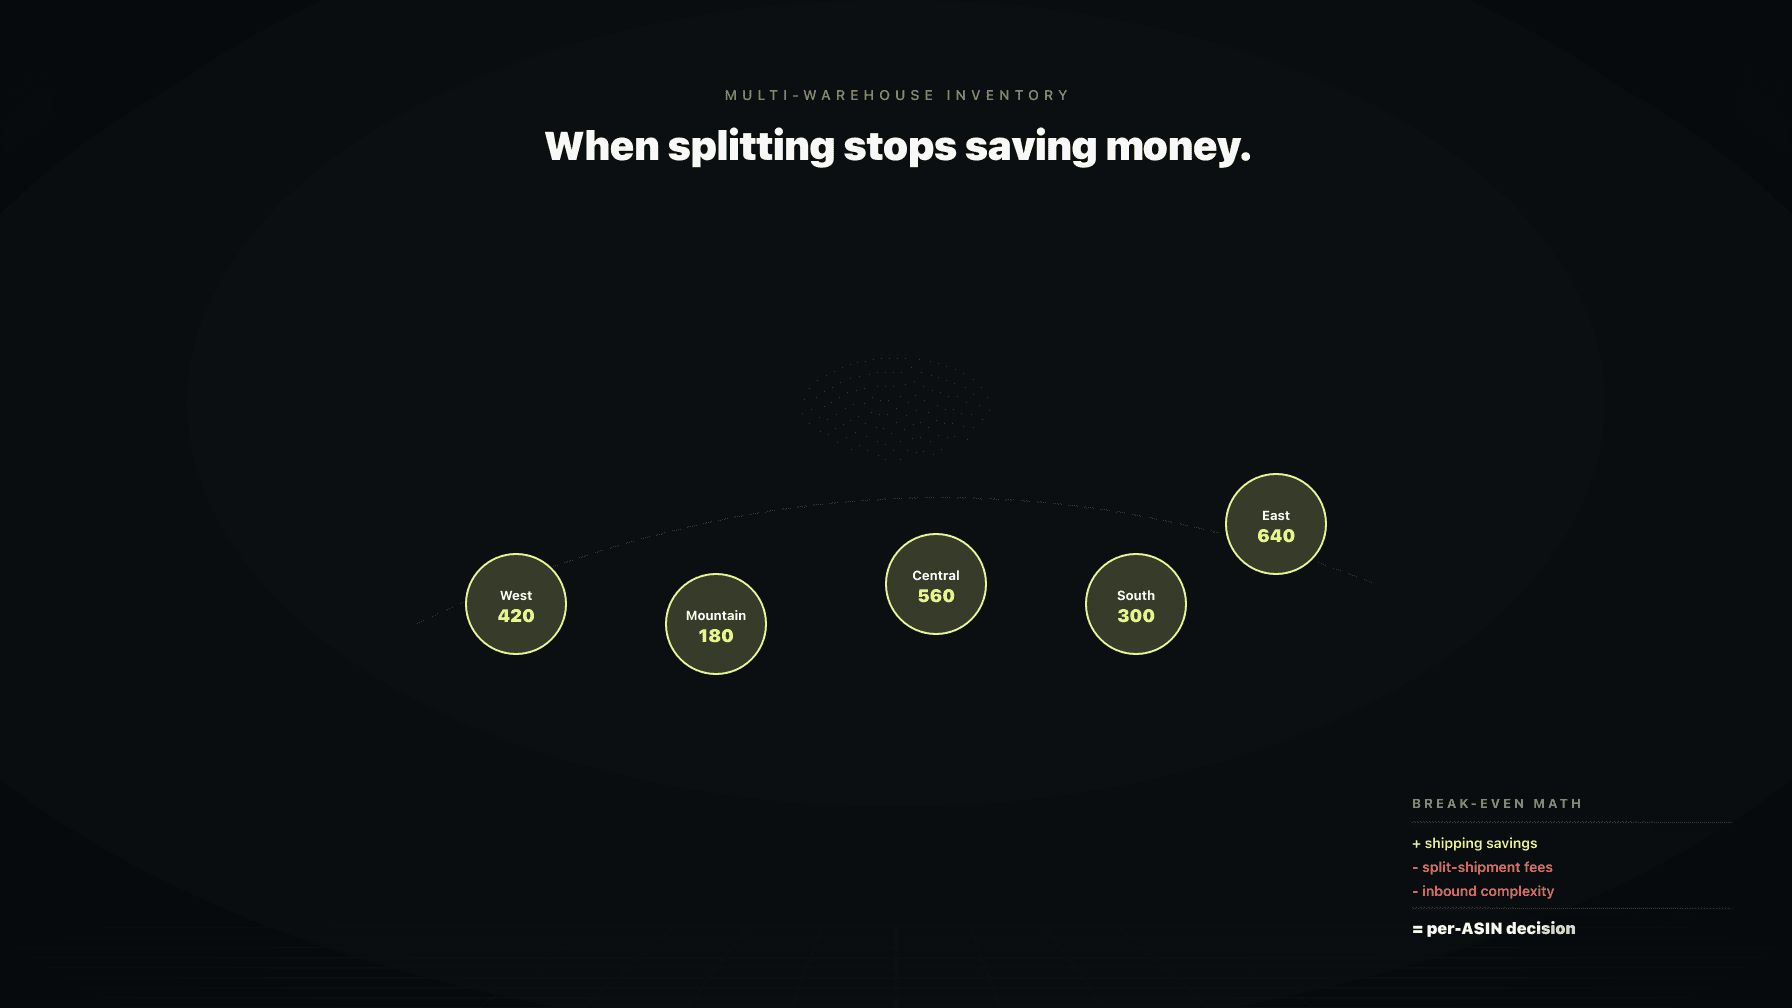
Why differentiate? Capital is finite. Storage is not free. Carrying 99 percent service-level inventory across 4,000 SKUs makes you cash-poor and storage-fee-rich. Tier defaults also make the job tractable: tune 20 heroes by hand, let tier defaults handle the rest.
Most operators review inventory parameters once a year, usually before Q4 planning. Too rare, for two reasons.
Velocity changes faster than that. A PPC ramp, a deal page placement, a competitor stockout, a price test that worked: any of these can shift trailing velocity 20 to 40 percent inside a quarter. Annual review locks in velocity from a different business.
Lead time changes faster too. Freight costs, port congestion, factory holiday schedules, tariff updates, carrier route changes. Lead-time distributions in 2026 are not the same as 2024.
Recommended cadence:
This is not glamorous work. It keeps a catalog running without surprises. It is exactly the work an AI agent can support: pull trailing velocity, recompute percentiles, surface the ASINs whose parameters have drifted. Operator still makes the call.
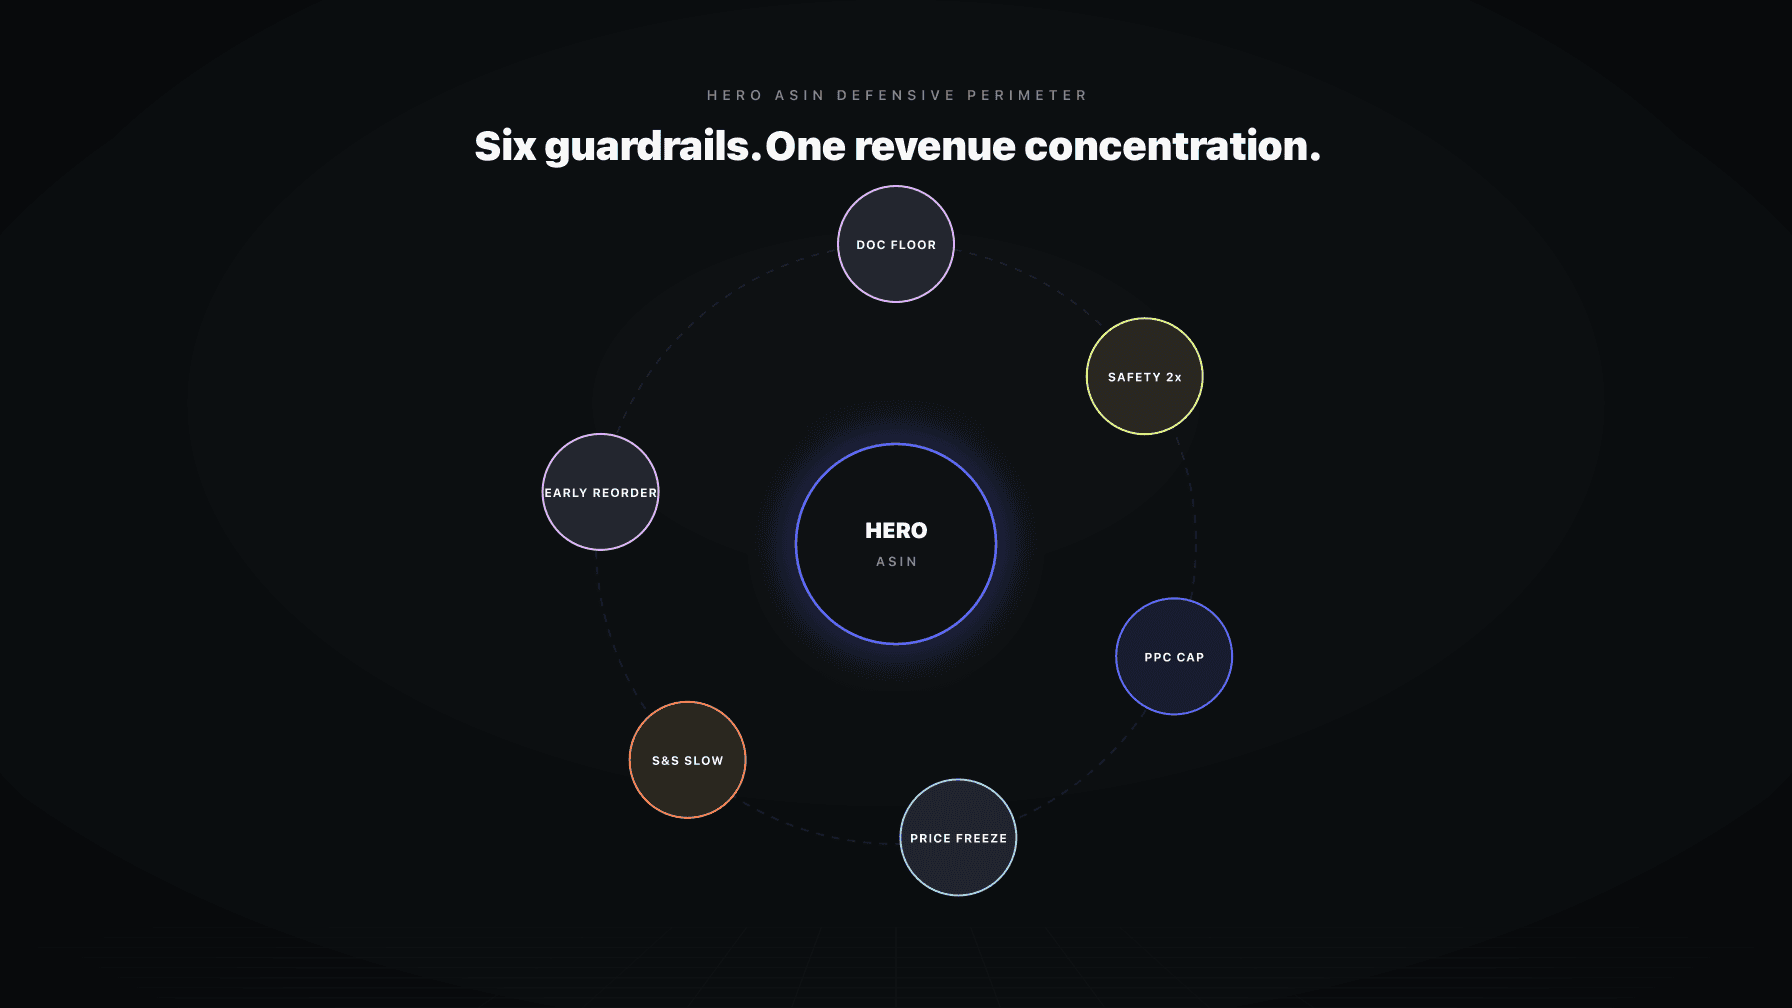
Bruno runs on a specific philosophy: operator sets the floor, agent executes against the floor, agent does not move the floor without operator signature.
For inventory, that means days of cover, reorder point, and safety stock are explicit settings. You set them per ASIN, per tier, or inherit tier defaults. Bruno consumes them. Bruno does not invent them.
What Bruno adds:
The job of an AI demand planner is not to replace the operator. It is to make the quarterly review fifteen minutes instead of three days, and to make sure the agent never executes against drifted numbers.
The repricing floor and ceiling math post covers the price-side of the same pattern. Our inventory management overview covers the broader picture, the AI demand planner page shows Bruno for this specific job. Pricing on the pricing page, and you can apply to work with us if this is the operating model you want.
Days of cover is how many days your current inventory will last at today's sales velocity. Formula: current on-hand units divided by daily velocity. 1,800 units on hand at 30 per day equals 60 days of cover. It is a snapshot, not a trigger. Operators usually compute three versions: FBA only, FBA plus in-transit, and total including reserve.
Reorder point equals daily velocity multiplied by 95th-percentile lead time, plus safety stock for demand variance. Most operators use average lead time, which is wrong, because half of shipments arrive later than average. Use the 95th-percentile lead time from your last 12 PO landings (or your worst case so far if you have fewer than 12). Keep safety stock as a separate, tunable number.
Depends on tier and variance in both demand and lead time. The operations-research formula combines both variances with a service-level multiplier (Z = 1.28 for 90 percent, 1.65 for 95 percent, 2.33 for 99 percent). Hero ASINs: target 97 to 99 percent. Long-tail SKUs: 85 to 90 percent. "Two weeks of trailing velocity" is a serviceable starting heuristic for mid-tier SKUs.
Yes, almost always. Hero ASINs drive the majority of revenue, and a stockout costs rank, review velocity, and Buy Box position. The damage compounds for months. Target 97 to 99 percent service level on heroes, 85 to 90 percent on long tail. Capital is finite. Spend it where contribution is highest.
Stop using one lead-time number per supplier. Pull the last 12 PO landings, sort by elapsed days from PO to FBA receive, record both the average and the 95th percentile. Plan reorder points against the 95th percentile. Refresh the percentiles as new POs land, at minimum quarterly. Freight conditions shift faster than annual review can catch.
Hero ASINs: monthly. Mid-tier: quarterly. Long-tail: semi-annually, or whenever a stockout or pile-up tells you the parameters are wrong. Annual review is the common cadence, and it is too slow. An AI agent can do the trailing-data arithmetic continuously and surface SKUs that need a parameter update.
Same metric, different units. Days of cover is on-hand divided by daily velocity. Weeks of inventory is on-hand divided by weekly velocity (or days of cover divided by 7). Amazon teams use days of cover because FBA inventory tracking is daily. Retail teams shipping to brick-and-mortar accounts use weeks of supply because replenishment cycles are weekly.