Chad Rubin
May 3, 2026 · Updated May 11, 2026 · 12 min read
Operator notes by email
Short, opinionated takes on AI agents, Amazon PPC, pricing, and inventory. No fluff. About once a week.

Most Amazon sellers set their repricing floor at COGS plus FBA fees, add a small markup they hope is profit, and call it done. That floor is wrong by enough that a category leader can run a repricer for an entire quarter, hit every velocity goal on the dashboard, and still finish thinner on contribution margin than the year before.
The reason is simple. A floor is not the price below which you stop selling. A floor is the price below which selling another unit destroys money. Two different numbers. The first one is comfortable. The second one is the one you actually need.
A ceiling is the mirror problem. Most sellers do not have one at all. They let the repricer chase the Buy Box up whenever competitors disappear, never asking whether the demand curve at the top of the range deserves testing. That is upside left on the table every time a competitor goes out of stock.
This post lays out the operator math for both. Five components for the floor, an empirical method for the ceiling, two worked examples, and a quarterly review checklist. Numbers in the examples are illustrative, not real seller data.
## Key takeaways >- A real floor has five components: landed COGS, FBA fees, returns cost, allocated overhead, and an ad baseline. Most sellers count two.- The ad baseline is the line item nobody includes and nobody can afford to skip if PPC is funding any meaningful share of unit sales.- A ceiling is not a vanity number. It is the price at which conversion drops faster than margin grows. You find it empirically, not by guessing.- Floors and ceilings are not set once. Cost changes, competitive shifts, and inventory pressure all move the boundaries.- A repricer with a wrong floor is worse than no repricer. It feels like a system, but it is just a slow leak.- Different channels deserve different floors. A wholesale-bound unit and a Vine-bound unit do not have the same true cost.- Quarterly review is the smallest cadence that catches the drift. Monthly is better.
Ask ten Amazon sellers what their floor is and most will say "COGS plus fees plus a few points of margin." The floor, in their heads, is the minimum acceptable selling price. That definition has two problems.
First, it confuses accounting margin with contribution margin. Contribution margin is the per-unit dollars left after every variable cost the unit triggers. Some of those costs are not on the Seller Central fee report. Returns are variable. Customer service touches are variable. The portion of ad spend you have to run to keep the listing visible is variable. Exclude any of those and you have set a floor too low, and your repricer will sell units at prices that look profitable on a spreadsheet and are not.
Second, the "minimum acceptable" framing is backwards. The floor is not where you would prefer to stop. The floor is where the next unit sold makes you poorer. Below that price, every unit shipped is one you would have been better off not selling. The floor is the breakeven point for the marginal unit, with all variable costs honestly counted.
From reading to action
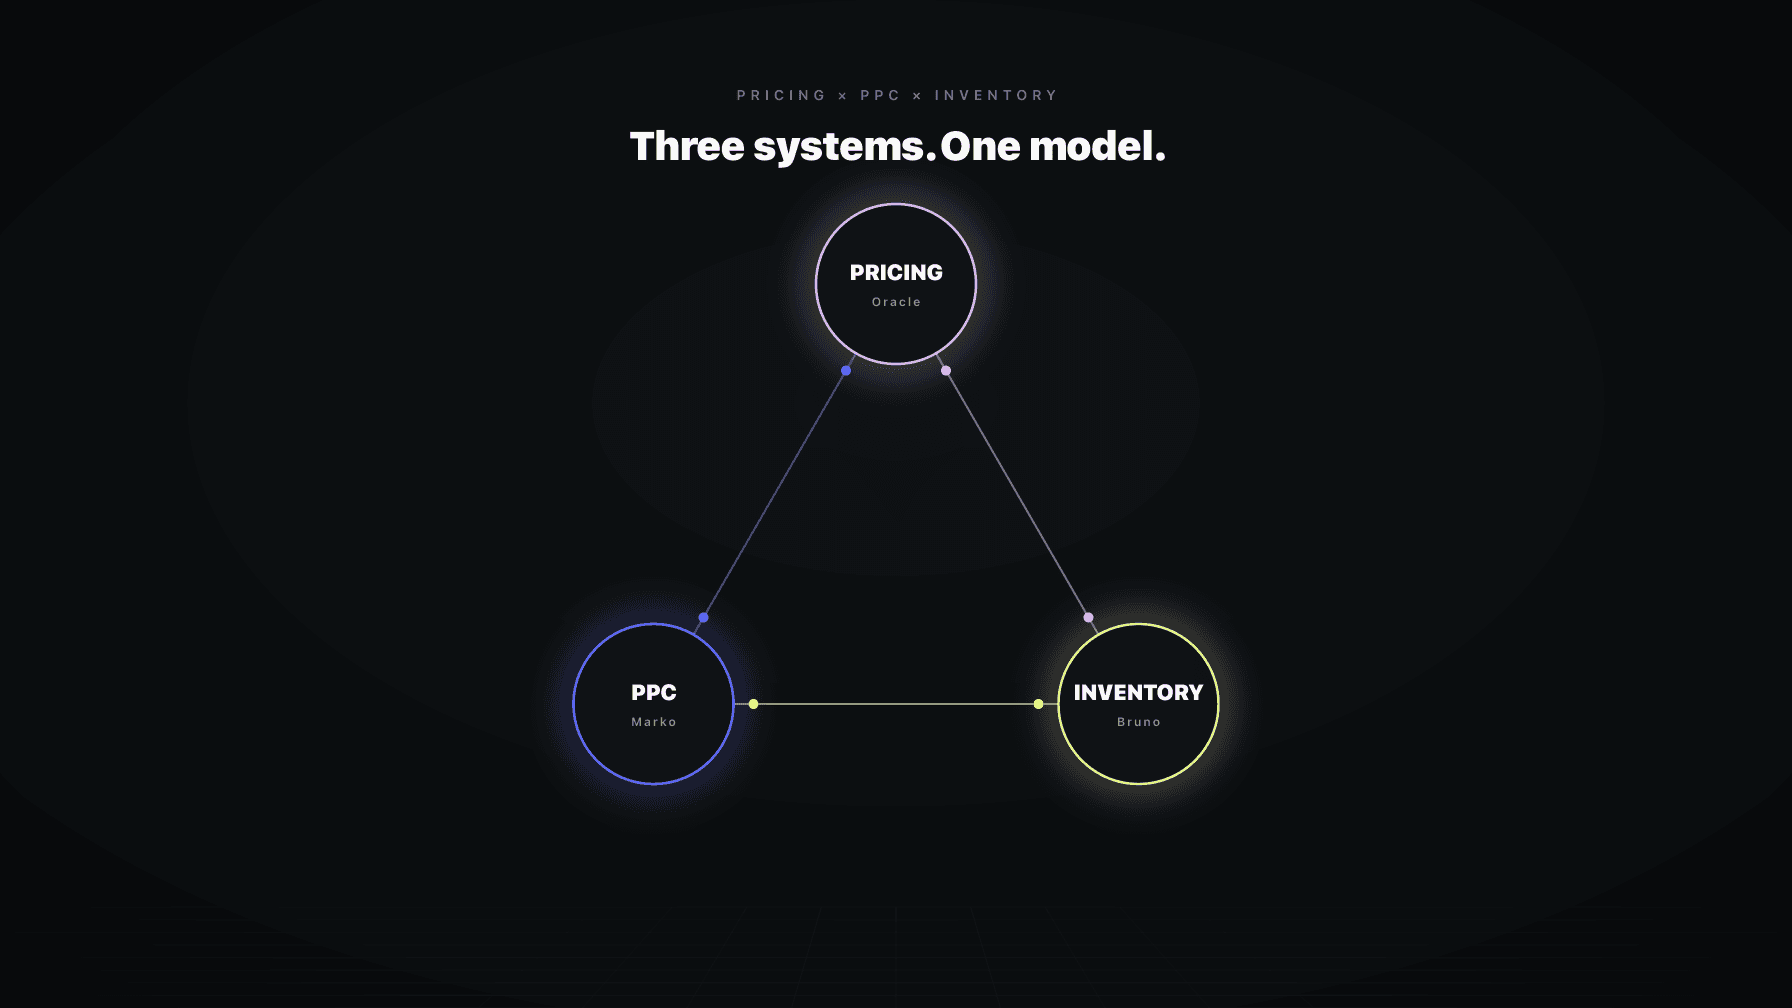
If the framework above sounds familiar, your Amazon account is probably carrying the same drag. Apply and we will show what Marko, Oracle, and Bruno would change in your first week.

Ran a 7-figure Amazon brand for a decade. Founded Skubana (acquired). Co-founded Prosper Show. 15+ years on Amazon.
Join the brands that replaced agencies and tools with AI employees.
Here is the structure that holds up under audit. Five components, in the order most sellers mis-count them.
1. Landed COGS. Manufacturing cost plus inbound freight plus duties plus prep or kitting. Landed, not factory invoice. The duty number alone moves a lot in 2025 and 2026, and a floor that is not refreshed when duty rates shift is stale.
2. FBA fees. Fulfillment, monthly storage, long-term storage where it applies, and inbound placement fees. The placement fee is the one most sellers still under-attribute. If you pay the partial split or full distribution fee, that is part of unit cost, not a separate operations line.
3. Returns cost. The line item that quietly destroys floor math. Three parts: the return processing fee Amazon charges, the disposition cost on the returned unit (resale, refurbish, dispose), and lost margin from units that come back unsellable. Multiply by the actual returns rate for that ASIN, not a category average. A 6% returns rate on a $30 ASIN is nothing like a 1.5% rate, and floors that pretend otherwise will eat you alive in apparel, supplements, or anything with sizing dynamics.
4. Allocated overhead. Some sellers argue this belongs in fixed costs, not in a per-unit floor. Wrong for floor-setting. If overhead does not get covered by the units you sell, the business does not exist. Allocate a per-unit overhead figure based on a realistic volume forecast for the period, refresh when forecasts change. It does not have to be perfect. It has to be present.
5. Ad baseline. The missing fifth component. There is a level of PPC spend the listing requires just to stay in front of relevant shoppers. Not discretionary growth spend, not launch push, but the baseline that funds the share of organic-equivalent visibility you cannot get for free. Divided by units sold, that is a per-unit cost. Exclude it and your floor assumes the listing sells itself.
Add the five and you have a real per-unit cost. Your floor is that cost plus a minimum contribution margin you want to defend. Some operators set the floor at exact breakeven. Some keep a few points of cushion. Either is defensible. A floor missing components three through five is not.
Numbers below are illustrative. Use the structure, not the figures.
Take a hypothetical $30 retail ASIN, standard size, 6% returns rate. Walk the five components.
Total real per-unit cost: $16.81. At $30 retail, about $13.19 of contribution margin per unit, roughly 44%.
Now the floor most sellers would set: COGS plus FBA plus a small margin, maybe $14.50. The repricer is allowed to drop to $14.50, where the seller thinks they are still making something. They are not. At $14.50 they are losing $2.31 per unit, with returns and overhead and ads doing the bleeding silently. The repricer sees no problem. The dashboard sees no problem. The end-of-quarter P&L sees the problem and nobody can explain it.
A real floor sits at the $16.81 breakeven plus whatever cushion the operator wants. To defend 5% contribution on every unit, the floor is $17.65. Above that, the repricer moves freely. Below it, the system is doing damage on autopilot.
Same structure, different category. A consumable at $24.99 retail with a Subscribe and Save share above 40%. Returns rate is much lower, around 1.2%, because consumables get used and rarely come back. The SnS discount is a real cost the repricer has to respect.
Subtotal: $11.68. One-time purchase floor: $11.68 breakeven, $12.27 with a 5% cushion. Retail at $24.99 leaves plenty of room.
Here is the tricky part. The repricer sometimes wants to chase a competitor down to $19.99 during a coupon-heavy window. At $19.99 you are still well above breakeven. The temptation to let it run is high. But for a subscription product, the floor needs a second test: does the new price reset a low anchor on your SnS subscriber base? Subscribe and Save references recent low prices in some scenarios, and a transient drop can compress repeat-purchase margin for months.
For a subscription category, the floor is breakeven plus a strategic guardrail that prevents the repricer from anchoring the SnS window too low. Many operators set this at 80% of the typical promotional price, not breakeven. The math says the repricer could go lower. The strategy says it should not. This is where rule-based repricers fail and a smarter approach earns its keep.
The ceiling is the price above which incremental revenue per unit no longer compensates for the conversion drop. It exists. It is real. It is rarely set.
Most sellers think of pricing as defending a position against competitors. That framing pushes pricing only one way: down, in response to a competitor cutting. The repricer enforces the downward pressure efficiently. Almost no system enforces the upward test.
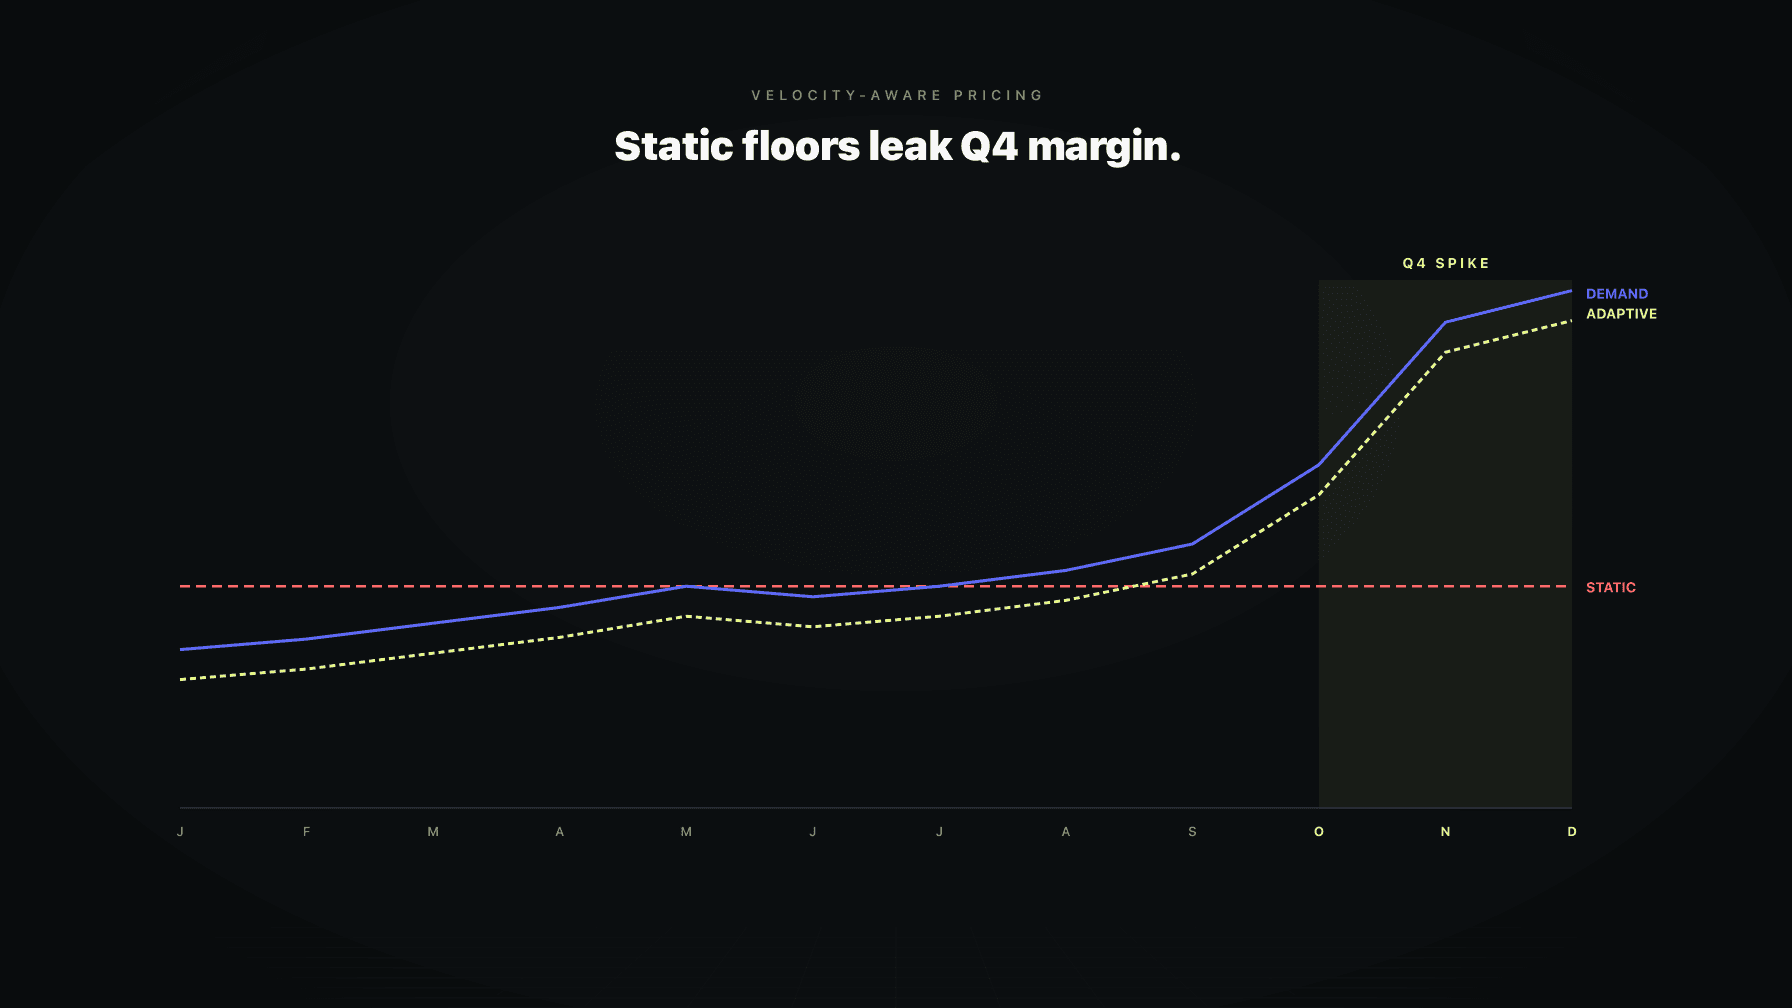
When a competitor goes out of stock, when a category goes into a holiday, when a complementary product spikes search volume, demand at the high end of the range is suddenly different than it was a week earlier. The conversion penalty for raising price by 4% might be smaller than the historical curve suggests. A repricer that does not test this leaves money on the table every time conditions favor it.
A ceiling, properly set, says: above this price, conversion drops faster than margin grows, and we know because we measured. Below it, the repricer can test upward. Above it, you have data showing the test fails. Without a ceiling, the repricer treats price as something to defend down to, never something to push up against. That is a costly asymmetry.
The cleanest way to find the ceiling is the 5% test. Simple in concept, disciplined in execution.
Pick an ASIN with stable conversion and reasonable daily volume. The test is noisy on slow movers, so do this on movers. Raise price by 5% from the current selling price. Hold it a full two-week window. Compare conversion rate, sessions, units sold, and contribution dollars to the trailing two weeks.
The output is one of three shapes. Shape one: contribution dollars are higher despite lower units. The increase improved per-unit margin enough to cover the conversion drop. The ceiling is somewhere above. Run the test again from the new price. Shape two: contribution dollars are flat. You are at or near the ceiling. Shape three: contribution dollars dropped. You went past it. Walk back to the previous price and call that the ceiling for now.
Two operating notes. Two weeks is the minimum because Amazon's algorithm needs time to absorb the change and shopper conversion data needs time to stabilize. Less than two weeks tells you very little. And do not run the test during a category-wide event like Prime Day, Black Friday, or a major launch. Demand is not representative. The ceiling is not permanent. Re-test quarterly, or whenever competitive context shifts.
Floors and ceilings are not lines you draw once and forget. They drift. Three categories of change should trigger a refresh.
Cost shifts. Any movement in landed COGS resets the floor mechanically. Freight rates, duty rates, factory price increases, FBA fee schedule updates, storage fee changes, return rate trends. None of these announce themselves on the repricer dashboard. Refresh inputs or your floor is running on a stale snapshot.
Competitive shifts. A new competitor entering with aggressive pricing changes the floor through ad baseline. If you have to spend more on PPC to hold visibility, ad baseline goes up, real per-unit cost goes up, floor follows. Reverse when a major competitor exits: ad baseline can drop, floor comes down, the repricer can compete more aggressively because each unit is cheaper to acquire.
Inventory shifts. When inventory is heavy, you may accept a lower contribution margin to clear the position before storage fees compound. When inventory is light, defend a higher contribution margin because every unit sold is harder to replace. Floors that ignore inventory state will sell out the wrong stock at the wrong price. Ceilings that ignore inventory state will fail to capture upside on slow movers where you have plenty of room to test.
A repricer that knows cost, competitive, and inventory state at the same time is doing real work. A repricer that knows only the Buy Box price is just reacting.
Recurring patterns. Each looks small in isolation. Each compounds.
Stale COGS. A factory price increase three months ago that never made it into the repricer. Every unit sold since is mispriced.
Ignored placement fees. Many floors still do not include the inbound placement fee. Meaningful per-unit miss.
Returns counted as a category average. Returns are highly variable by ASIN, even within the same brand. Use the actual rate, refreshed at least quarterly.
Ad baseline excluded entirely. The most common single mistake. PPC lives in one spreadsheet, the repricer in another, and the floor never reflects the per-unit cost of running ads.
Overhead dumped into a fixed-cost bucket. If it is not in the floor, the floor is fictional.
One floor across all channels. Vine, wholesale, direct, 1P do not have the same cost structure. One number means at least three are wrong.
Fewer mistakes here, mostly because most sellers do not have a ceiling at all. The ones who do still get a few things wrong.
Setting the ceiling at the historical maximum. Wrong reference point. The historical max was set under historical conditions. Test from current.
Not retesting after a competitor exits. Exactly when the ceiling needs a fresh look. Most operators do not retest, and the upside passes.
Treating the ceiling as a hard cap rather than a current best estimate. It is a measurement, not a rule. If you have not retested in 90 days, you do not know where it is right now.
Confusing competitor price with ceiling. Competitor price is a competitive datum. The ceiling is a demand datum. You can sometimes profitably price above the highest competitor for a window.
Once a quarter, run this list against every ASIN that contributes meaningful contribution dollars. Top 20 by contribution is a good cut for most catalogs.
The first time through this list takes a long afternoon. After that it is a couple of hours.
Oracle does not run on a guessed floor. Loaded COGS requires all five components: landed COGS, FBA, returns rate per ASIN, allocated overhead, and ad baseline. If any are missing, the system flags the ASIN before it will reprice it.
Floor and ceiling are editable in Mission Control, and both have a quarterly review prompt that surfaces ASINs whose inputs have drifted: COGS not refreshed in 90 days, returns rate moving outside its trailing window, ad spend per unit shifting, ceiling not tested recently. The prompt does not change the price. It tells the operator which ASINs need attention.
That is the loop: honest inputs, editable boundaries, a scheduled review that catches drift, and an upper boundary that gets tested rather than guessed.
Your floor should be the breakeven price for the marginal unit, from five components: landed COGS, FBA fees, returns cost at the actual ASIN rate, allocated overhead, and an ad baseline. Add a cushion if you want defense above breakeven. The common mistake is COGS plus FBA plus a small markup, which understates real per-unit cost by skipping returns, overhead, and ads.
Take the selling price, subtract the five floor components, and what is left is true contribution margin. Subtracting only COGS and FBA gives you gross margin, which overstates profitability by enough to mislead pricing decisions.
Yes. The PPC spend that funds baseline visibility is a per-unit variable cost. Take trailing 90-day baseline ad spend for the ASIN, divide by units sold in the same window, include the per-unit number as the fifth floor component.
A ceiling is the price above which conversion drops faster than per-unit margin grows. Find it empirically by testing 5% price increases over two-week windows and comparing contribution dollars. You need one whenever competitive conditions create upward pricing room: a competitor going out of stock, a category event ending, a complementary product spiking search.
Quarterly at minimum, monthly is better. Update immediately when landed COGS changes, when FBA schedules change, when ASIN returns trends shift, when ad spend per unit moves materially, or when competitive context changes. Floors not refreshed in six months are almost always wrong by enough to matter.
The repricer sells units at prices that look profitable on a basic spreadsheet but are not. The dashboard shows green, units move, Buy Box stays won. End-of-quarter contribution comes in below expectation and the cause is hard to attribute because every transaction looked fine. A too-low floor is worse than no repricer.
Yes, and you should. Vine, wholesale, 1P, and direct do not have the same cost structure. One floor across all channels guarantees at least some are mispriced. Maintain channel-specific floors and route the repricer accordingly.