Chad Rubin
May 8, 2026 · Updated May 11, 2026 · 12 min read
Operator notes by email
Short, opinionated takes on AI agents, Amazon PPC, pricing, and inventory. No fluff. About once a week.
After ten years running a private label brand on Amazon, the hardest problem is not running any one system well. Plenty of operators run a tight pricing engine. Plenty run a tight PPC operation. Plenty run clean inventory planning. The hardest problem is keeping all three coordinated when each one is changing every day.
That is where margin leaks. Not in the pricing tool, not in the PPC tool, not in the inventory tool. In the spaces between them.
I call it coordination drift. Each system is doing the locally correct thing based on the data it can see. The pricing tool drops price to defend Buy Box. The PPC tool sees conversion rate climb and pushes more spend. The inventory tool sees velocity spike and pulls in the next PO. Three months later you stock out at peak season because nobody told the inventory system that the velocity spike was bought, not earned.
This is the operator brief on how the three systems couple, what coordination drift looks like in your P&L, and what an integrated approach has to do at the data layer to fix it.
Every Amazon brand runs on three operational systems whether the operator names them or not.
Pricing. The decisions that determine what the listing sells for at any moment. List price, sale price, coupon, promotion, Subscribe and Save, Vine. Pricing affects margin per unit and conversion rate.
PPC. The decisions that determine paid traffic. Bids, budgets, targets, placements, dayparting, audiences. PPC affects cost per acquisition, total spend, and impression share.
Inventory. The decisions that determine what supply is available where, and when more shows up. Days of cover, inbound POs, FBA shipment plans, multi-region distribution. Inventory affects how aggressive you can be on demand without running out, and how much working capital is tied up.
From reading to action
If the framework above sounds familiar, your Amazon account is probably carrying the same drag. Apply and we will show what Marko, Oracle, and Bruno would change in your first week.

Ran a 7-figure Amazon brand for a decade. Founded Skubana (acquired). Co-founded Prosper Show. 15+ years on Amazon.
Join the brands that replaced agencies and tools with AI employees.
Each system has its own optimization function. Pricing wants to defend margin. PPC wants to hit a target return. Inventory wants to avoid stockouts and avoid sitting on dead supply. Run each in isolation and each looks fine. Run them together and the optimization functions fight each other most days of the year.
Every variable that one system controls is an input to the other two. Price affects conversion rate, which affects ad return, which affects your willingness to bid. Bids affect velocity, which affects days of cover, which affects how much risk you can take on price. The three are a triangle, not three independent boxes.
Drop your price by 5 percent and three things happen on the PPC side, usually within 48 to 72 hours.
Conversion rate goes up. The same ad click now closes more often, so cost per acquisition drops without touching a bid.
Profit per order goes down. The unit margin is thinner, so the ad spend you can afford per order is thinner too. POAS (profit on ad spend) gets harder even when ACOS gets easier.
Organic rank lifts. The conversion rate signal feeds the algorithm, velocity climbs, and you take share back from organic.
If your PPC tool is only optimizing to a fixed ACOS target, all three effects are invisible to it. It sees the conversion improvement and chases it. It does not see the margin compression. It spends more on a worse-margin sale and feels like a hero in the dashboard.
The right behavior is the opposite. When pricing tightens, PPC has to retarget to a profit constraint, not a revenue constraint. When pricing loosens, PPC can lean in. This is exactly why we wrote up the target POAS vs ACOS argument and why pricing reduces ACOS when the two systems share state.
Crank PPC spend by 30 percent into a launch and sales velocity does not just climb. It gets noisier. The forecast that looked clean has a fat new tail of paid demand sitting on top of organic, and your planner has to figure out how much is sustainable.
If the inventory system reads the new velocity as the baseline, it pulls in more units. If PPC then dials back at the end of the launch, you are sitting on three months of cover at organic-only velocity. Working capital locked, FBA storage fees climbing, listing now defensive about discounting to clear the dead supply.
The reverse is just as costly. If the inventory system ignores the spend ramp, it forecasts on organic velocity, you stock out two weeks into the campaign, and every dollar of paid spend in the back half is on a product that cannot ship.
Inventory has to know what PPC is planning, not just what PPC did. The forecast input is the spend plan, not the historical velocity. Most stacks do not pass that signal.
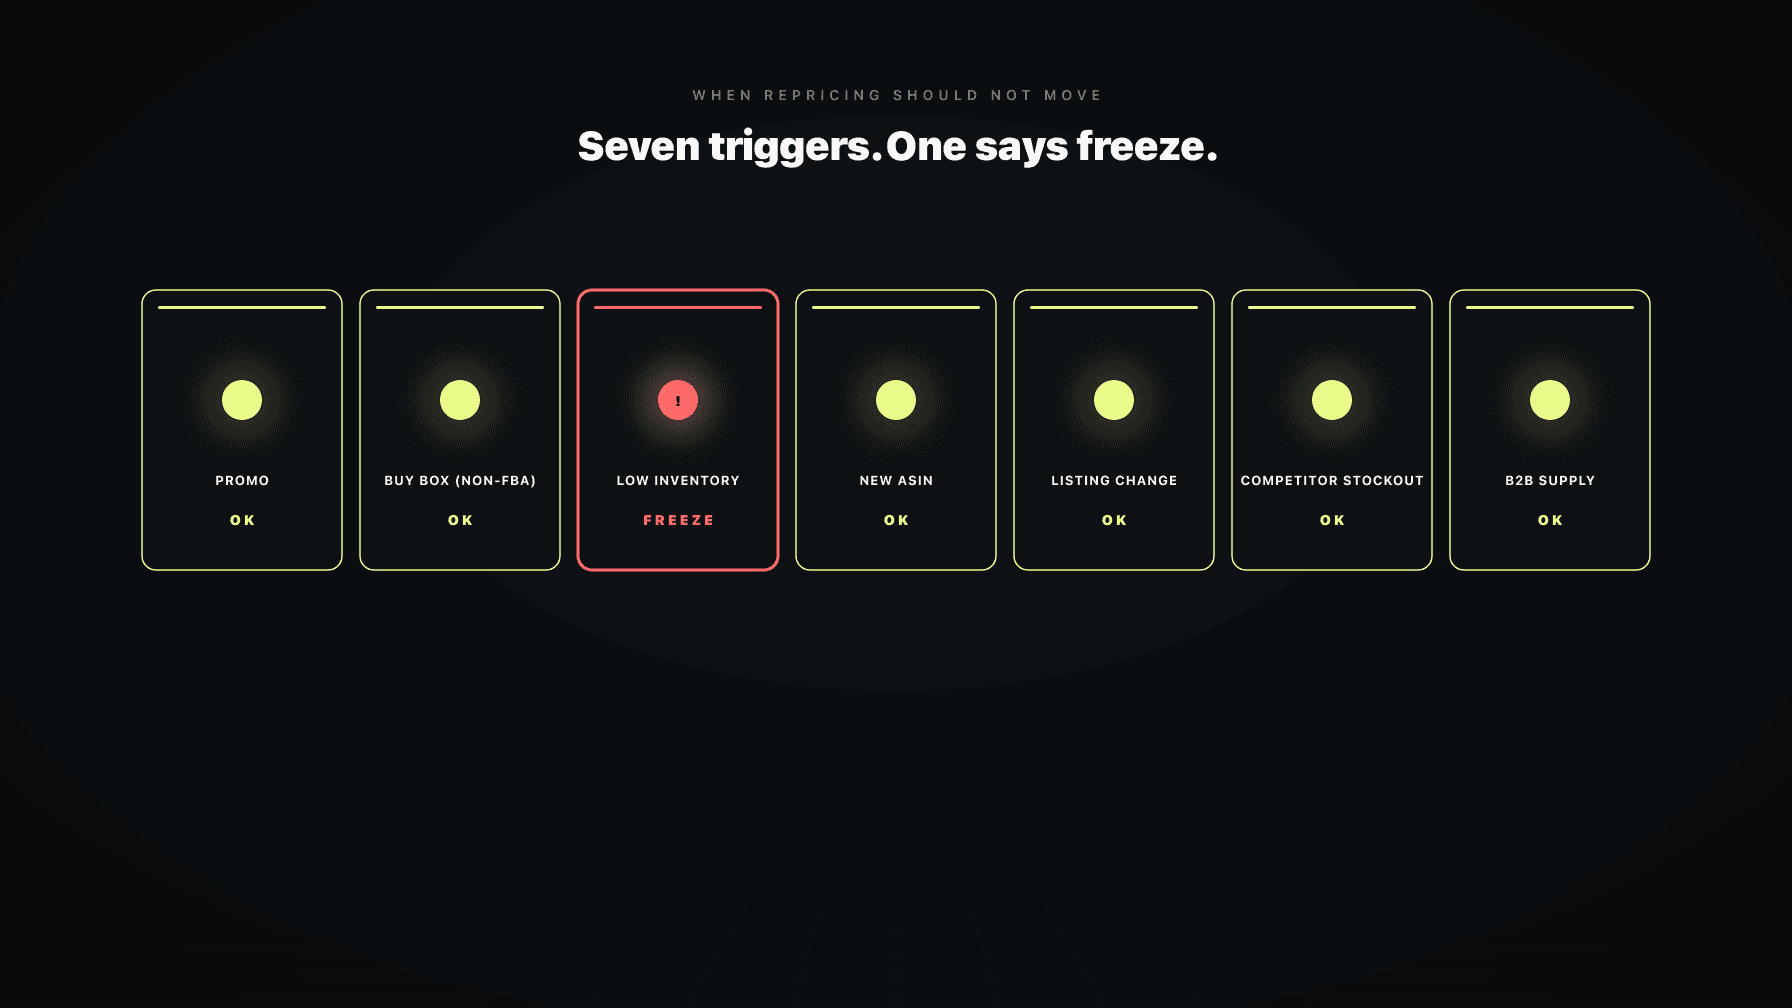
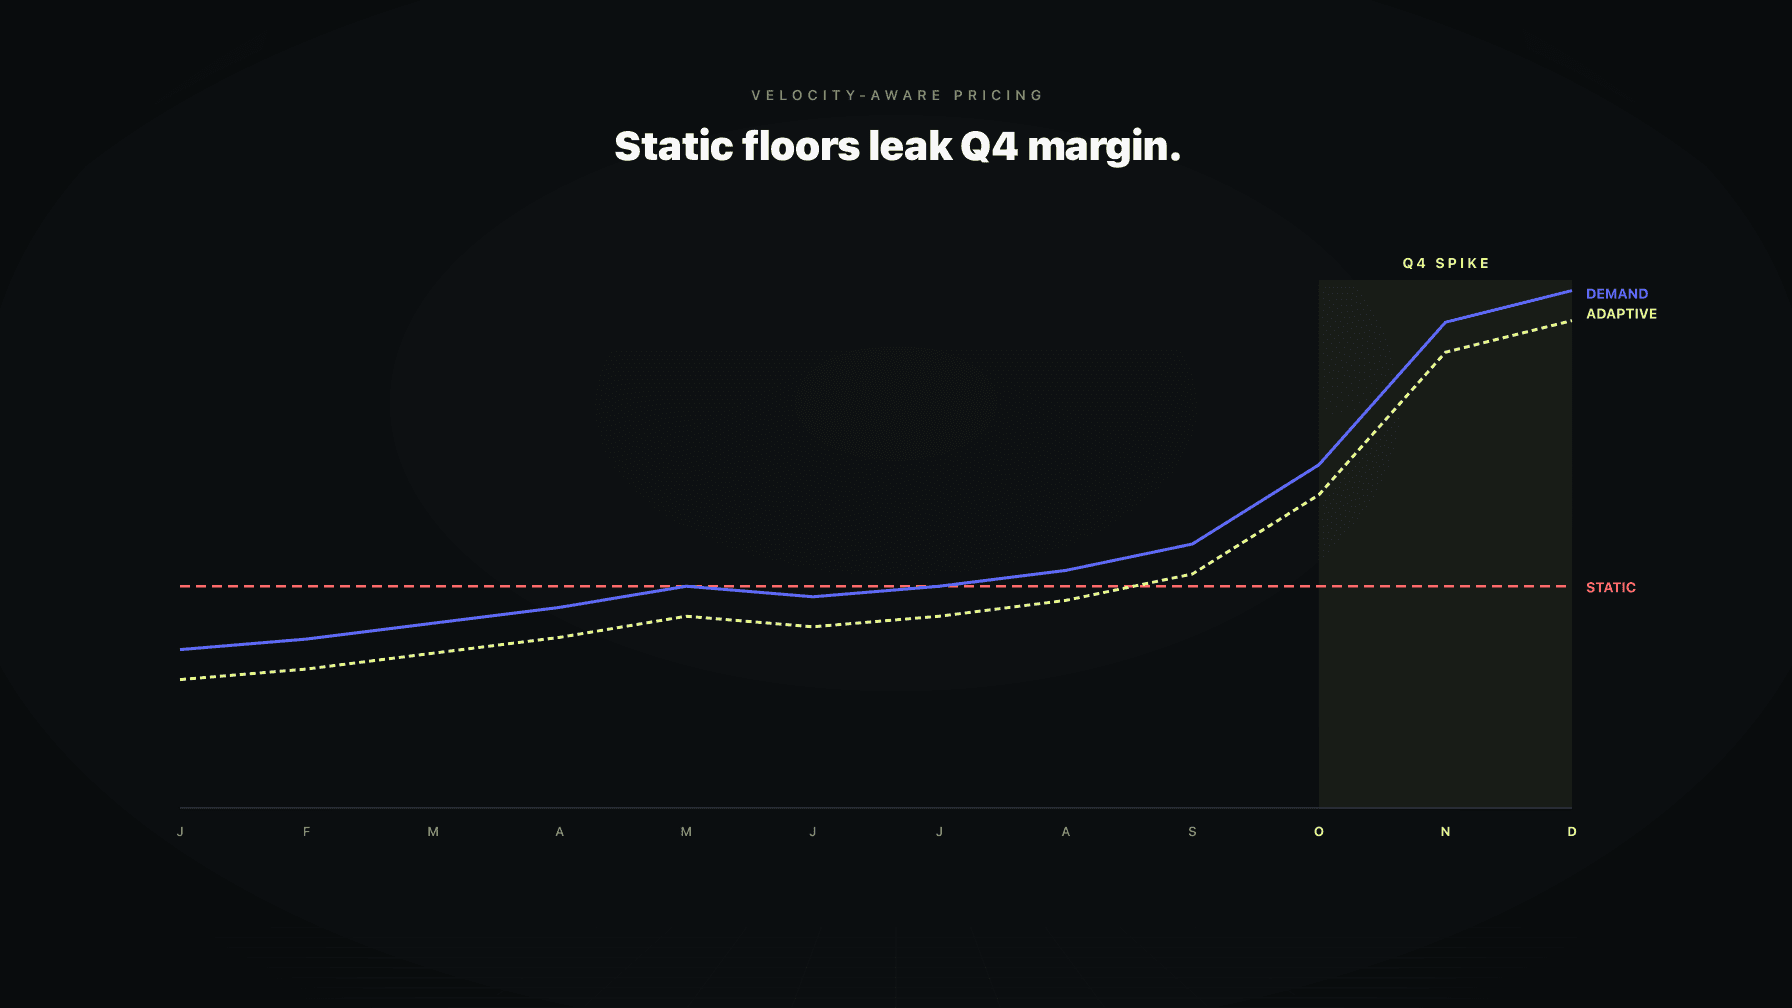
This is the loop disciplined operators already manage manually. When you have 200 days of cover, your floor is lower because the cost of a slow week is high. At 18 days of cover with the next inbound six weeks out, floor and ceiling both move up. Sometimes you should not be discounting at all. Sometimes you should be ratcheting price up to slow the bleed.
Pricing engines without inventory data move price the same way at 200 days as at 18. That is how brands drop price into a stockout, accelerate velocity, accelerate the stockout, and lose a month of organic rank rebuilding.
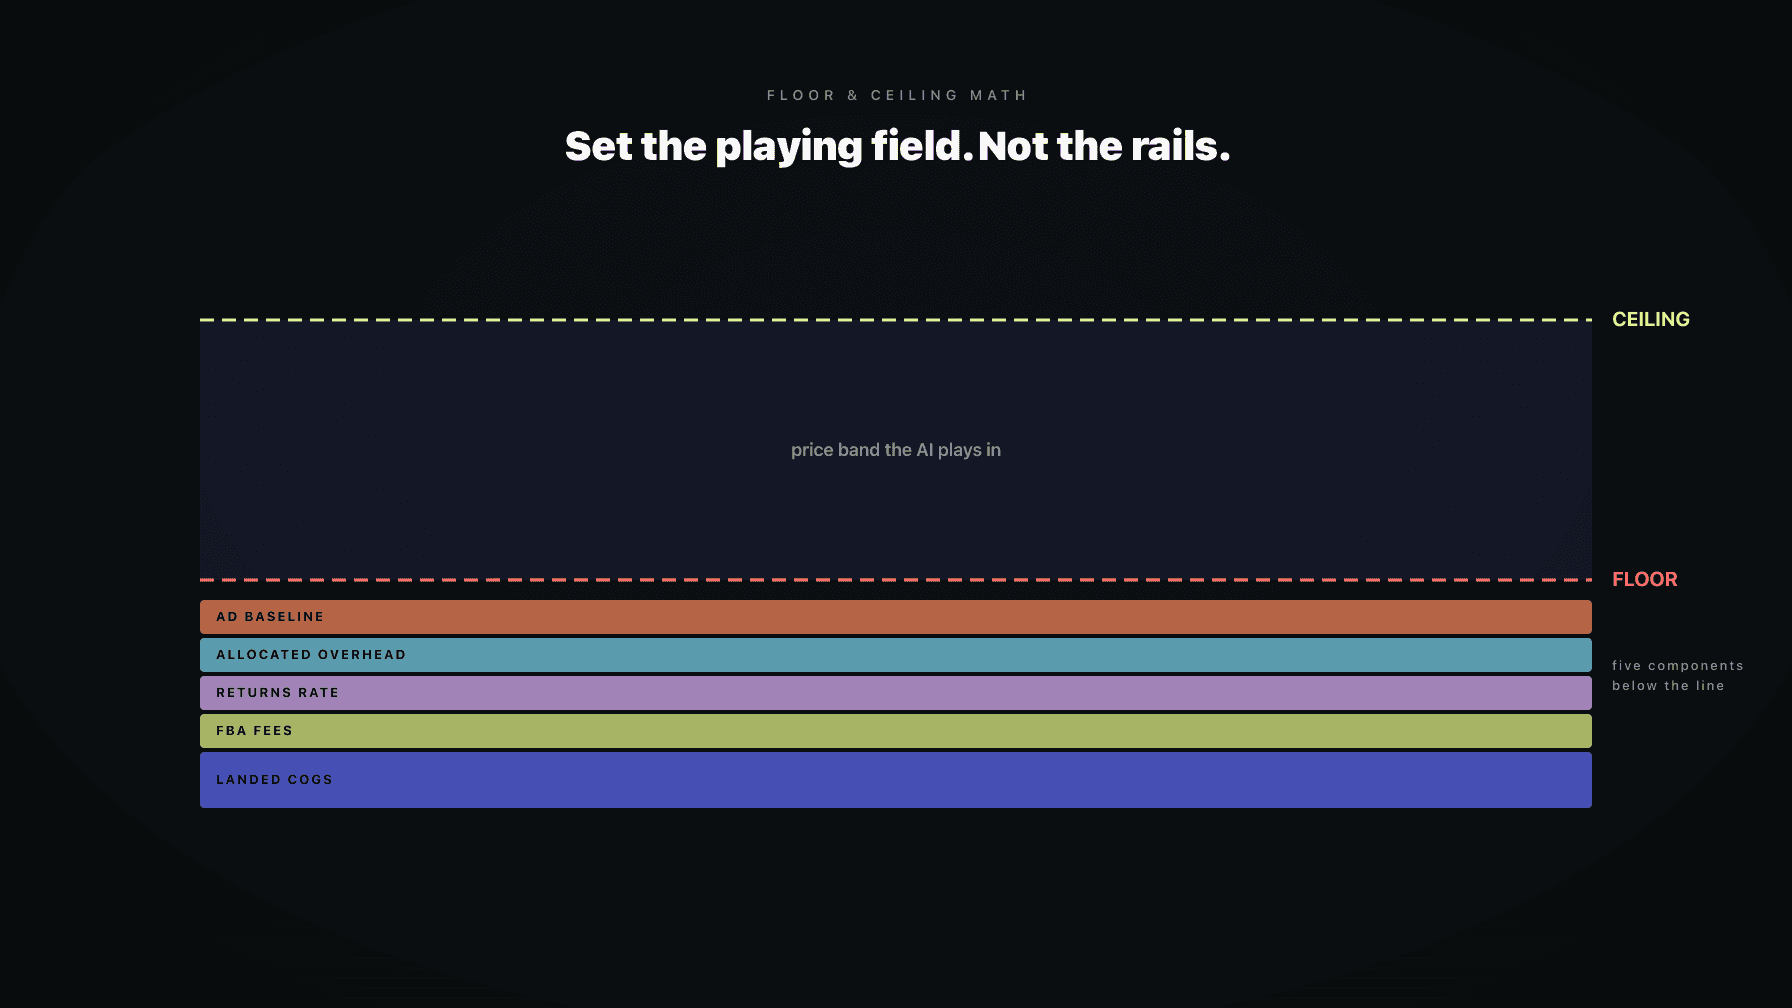
We unpack the math in the floor and ceiling brief and when repricing should not move. A static floor is not a floor. It is a fixed answer to a question whose inputs change every day.
Price is a demand lever. Lower price, more units. Higher price, fewer units. Every Amazon operator knows this in the abstract. Almost none of them feed it into the forecasting model.
The standard inventory forecast is a regression on past sales. It is a backward-looking model. The moment you change price, the relationship between past and future demand breaks. Your forecast is now wrong on day one and you will not see it in the data for two to three weeks, at which point you have already cut the next PO based on the wrong assumption.
A coordinated system has the demand planner consume the planned price action as an input. Drop the price 8 percent for a Prime Day promotion, the demand planner reforecasts on the new elasticity-adjusted curve and sizes the inbound shipment to match. This is one of the cleanest wins in coordination, and it is invisible if your three systems live in three different vendors.
Once your days of cover crosses a threshold, every dollar of PPC spend has decreasing marginal value. Past a certain point, you are paying to accelerate a stockout that is going to cost you organic rank for the next two months.
The right behavior is to throttle spend, not stop it. Defensive bids on branded terms stay. Aggressive bids on prospecting terms get pulled. Dayparting tightens to the highest-converting hours. Match types on the riskiest expansions get suspended.
In a siloed stack, this only happens when a human notices the inventory chart, opens the PPC tool, and starts manually pulling levers. By the time that human notices, two days of overspend have already happened. We covered this pattern in PPC bids fail without pricing and the broader case for cross-system guardrails.
This is the loop almost nobody talks about. When PPC has built sustained organic rank, the pricing system gets to be less defensive. Your Buy Box position is sticky. Your conversion rate has organic floor. You can hold price through small competitor moves without bleeding share.
When organic rank is shaky, the pricing system has to be more defensive. Every Buy Box loss now costs more because the click-through advantage you had is gone. The same competitor price drop that was a non-event last quarter is now a real threat.
The pricing engine has to read the organic strength signal. In practice that means search rank, SOV on key terms, and conversion rate trend, not just competitor price. A tool that only watches competitor price will move on every twitch and miss the strategic picture entirely.
Here is the part operators care about. Coordination drift does not show up as a line item. It shows up as a slow underperformance against where you should be.
Specifically, you see:
The frustrating part is none of this shows up in the dashboards of the individual tools. Each one will tell you it is doing its job. The damage is in the seams.
The fix is not better dashboards. The fix is shared state.
Shared state means the three systems read from the same source of truth and write decisions back to it in the same time window. Specifically:
This is not a UI problem. It is a data architecture problem. The reason most Amazon brands cannot solve coordination drift is that their pricing data lives in vendor A, their PPC data lives in vendor B, and their inventory data lives in vendor C, and the only integration between them is a human in Slack.
For more on the data layer, the AI operating system pillar walks through what shared state looks like in practice.
Every brand I know that has tried to solve this with process has hit the same wall. The process works for two weeks. Then someone goes on vacation, or a launch happens, or a competitor moves, and the human-as-coordinator becomes the bottleneck.
Three reasons it does not scale:
First, latency. By the time the inventory manager messages the PPC manager that cover is dropping, two days of overspend have already happened. The decision needed to be made in minutes.
Second, frequency. Coordination is not a daily decision. It is a per-SKU, per-hour decision in a brand with a real catalog. No human can make 4,000 coordination calls a day.
Third, retention. The human who knows that this SKU has unusual seasonality, or that this competitor always undercuts on Tuesdays, eventually leaves. The institutional knowledge does not transfer. The next operator rebuilds it from scratch.
This is the reason that even well-staffed brands have coordination drift. It is structurally impossible to solve with humans and Slack. The work is too fast, too frequent, and too dependent on continuity that humans cannot provide.
An integrated operating system does three things that a stack of vendors cannot.
It puts the three functions on one event bus. When pricing changes, PPC and inventory know within minutes. When inventory crosses a threshold, pricing and PPC know within minutes. The communication is not a CSV export or a webhook hand-off. It is a shared state model.
It runs the guardrails on combined state, not individual state. The system can hold a rule like: do not increase PPC spend on a SKU below 21 days of cover. Or: do not drop price below the velocity-adjusted floor when paid spend is throttled. These rules are impossible to enforce when each tool only knows its own state.
It gives the operator one surface to set targets and read what is actually happening. Not three dashboards in three vendors with three different definitions of margin. One surface, one set of definitions, one place to change the rules.
This is what changes coordination drift from a structural problem to a solved problem. The work that used to require three managers and a Slack channel becomes a system property.
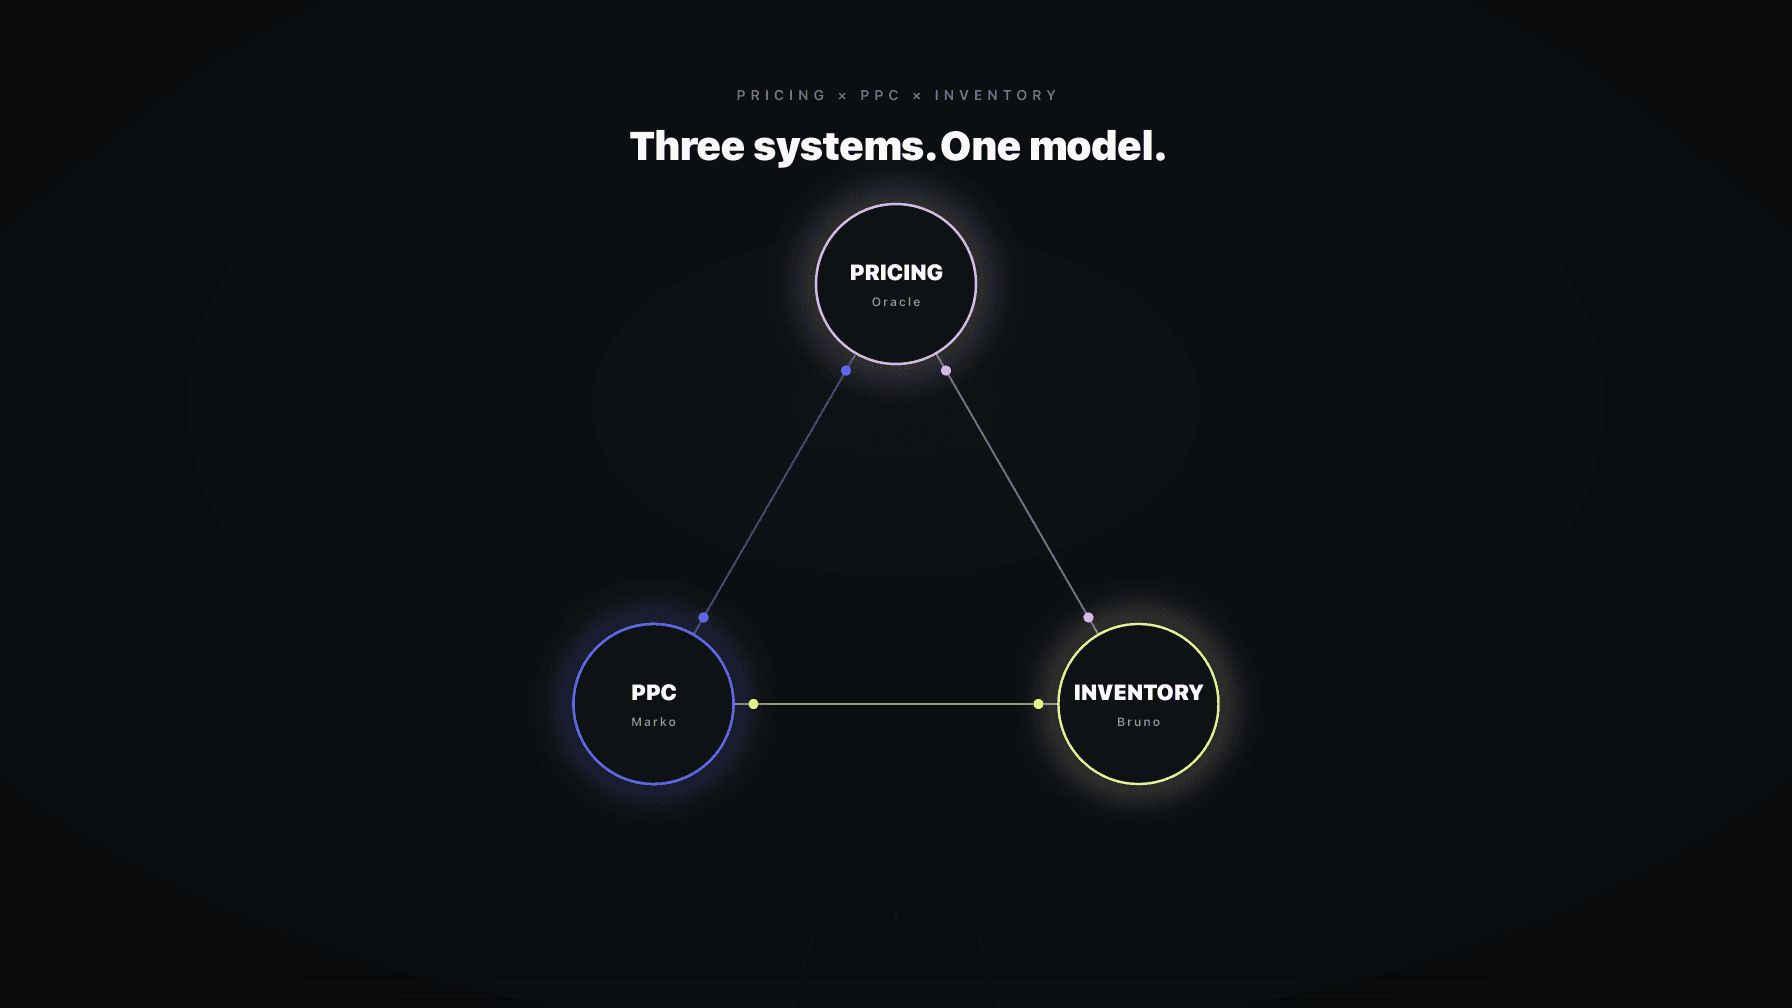
Profasee Ultra is built around three AI employees that share state by design.
Oracle is the pricing AI. It owns price decisions inside the floor and ceiling that the operator sets, and it reads from the same SKU model that the other two read from.
Marko is the PPC manager. It owns bid, budget, and target decisions, and it reads price, days of cover, and forecast directly from shared state.
Bruno is the demand planner. It owns forecast and inbound recommendations, and it reads planned price actions and planned spend ramps as forecast inputs.
When Oracle changes price, Marko sees it within minutes and adjusts POAS targets. When Bruno flags a low-cover SKU, Oracle pulls the floor up and Marko throttles prospecting spend. When Marko plans a launch ramp, Bruno reforecasts the inbound shipment to match.
The operator sits in Mission Control, sets targets and guardrails across all three, and watches one surface. Not three. The coordination work that used to be a daily Slack thread is a system property of the platform.
If you want the broader argument for why this architecture matters, the AI operating system pillar is the long version. If you want to see how it changes the day-to-day, the PPC playbook is the operating manual.
Pricing and PPC are tightly coupled through conversion rate and unit margin. A price drop raises conversion rate, which lowers ACOS even at the same bid. It also lowers profit per order, which raises the bar on POAS. A pricing change without a matching PPC retarget will hit ACOS goals and miss profit goals. The two have to share state and re-target together.
Inventory cover is a hard ceiling on how much ad spend makes sense. Below a threshold (typically 21 to 30 days of cover, depending on lead time), prospecting spend should throttle and defensive spend should hold. Spending into a stockout costs you twice: ad spend on a product that cannot ship, and organic rank decay during the out-of-stock window.
Coordination drift is the term for what happens when each system on a brand makes locally correct decisions that are globally wrong. The pricing tool drops price defensively, the PPC tool spends into the velocity lift, the inventory tool reorders on the inflated baseline, and a quarter later the brand has lower margin and a working capital problem. It costs margin because none of the three tools can see the combined effect, only their own slice.
No. Dashboards surface state. They do not coordinate decisions. The decisions still happen in three different tools by three different humans, and the latency between them is the source of the drift. Dashboards help diagnose coordination drift after the fact. They do not fix it.
Because they were built independently, by different vendors, on different data models, with no incentive to integrate. Each vendor wants to be the system of record for their slice. The result is three sources of truth, three definitions of the same SKU, and no shared state. Integrations via CSV or webhook can patch a few flows, but they do not produce real shared state.
An AI operating system runs the three functions on shared state with shared guardrails. Each function (pricing, PPC, demand planning) is an AI employee that reads from and writes to one canonical SKU model. Guardrails enforce combined-state rules that no individual tool could enforce alone. The operator sets targets and rules in one surface and the coordination is a system property, not a daily Slack thread.
At minimum: one shared SKU model, one event bus that propagates changes within minutes, one guardrail layer that operates on combined state, and one operator surface for targets and rules. Anything less is a vendor stack pretending to be a platform. The real test is whether a price change automatically updates the PPC target and the inventory forecast without a human in the loop. If a human is still the integration, the platform is not integrated.