Chad Rubin
May 27, 2026 · 10 min read
Operator notes by email
Short, opinionated takes on AI agents, Amazon PPC, pricing, and inventory. No fluff. About once a week.
Most Amazon brands run on revenue. They watch the topline, they celebrate a record sales month, and they find out in the quarterly review that the record month lost money. Revenue is the number everyone tracks because it is the easiest to see and the most fun to say out loud. It is also the number that tells you the least about whether your business works.
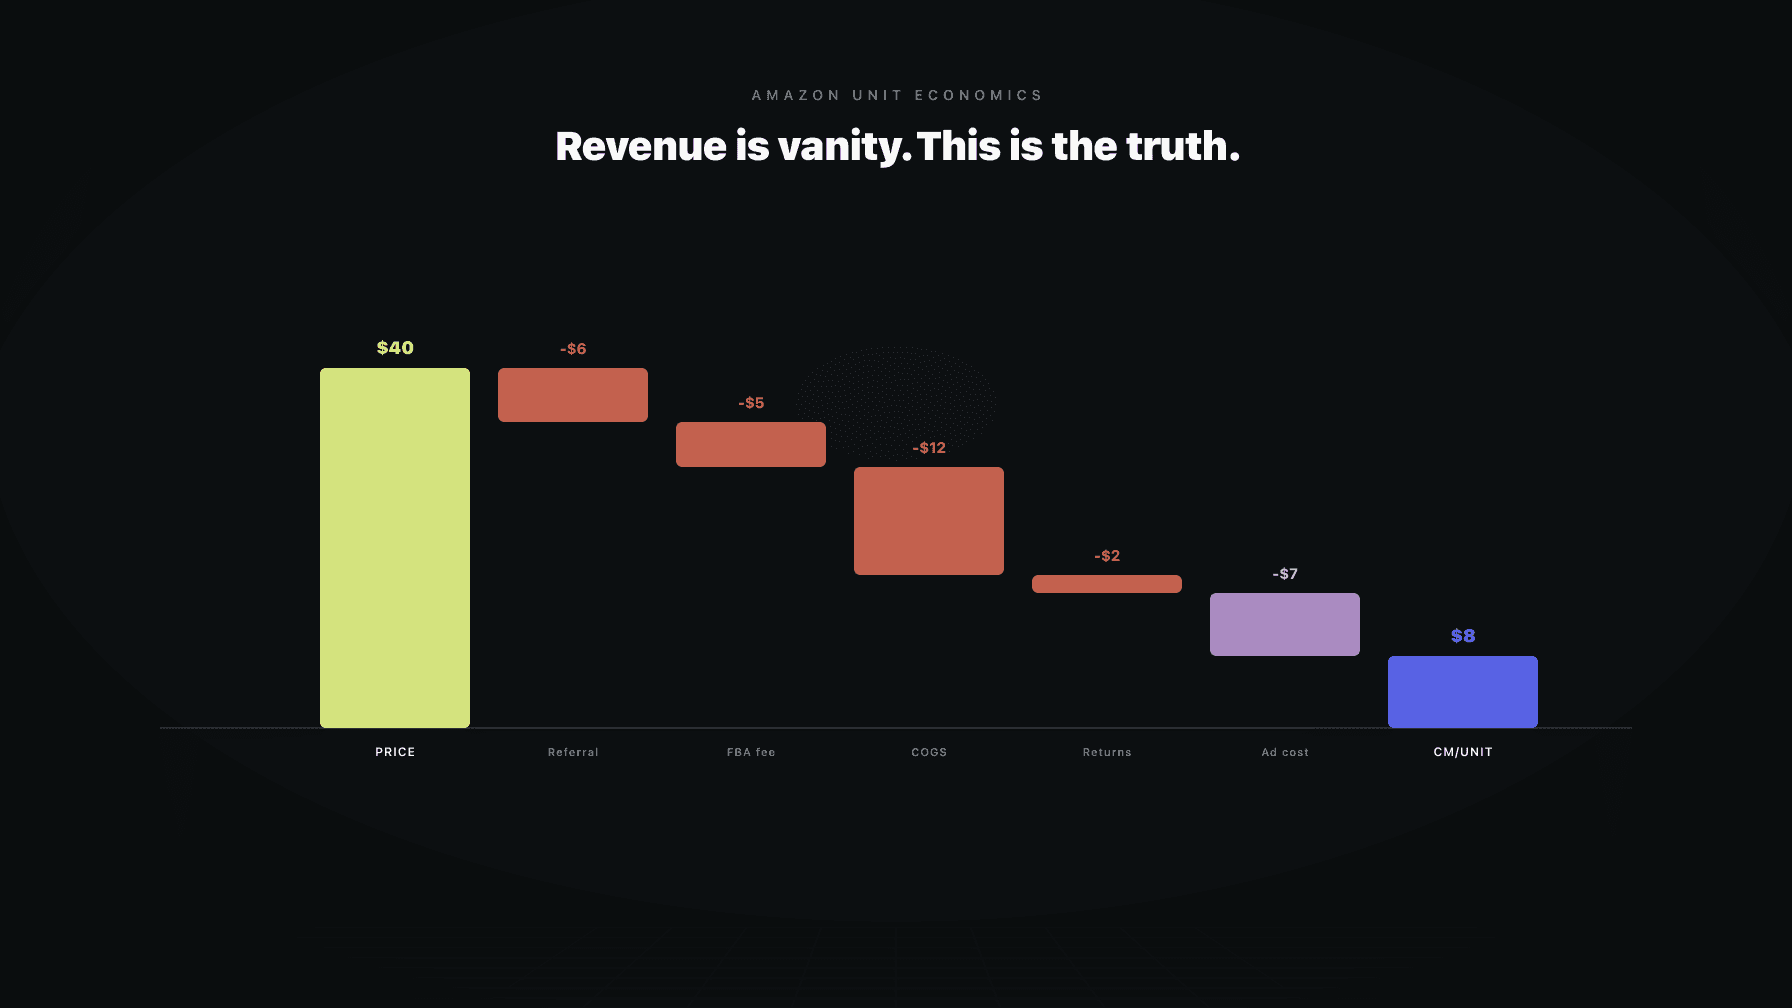
The number that tells the truth is contribution margin per unit. It is what survives after every cost that scales with the sale: the referral fee, the FBA fee, the landed cost of goods, the returns reserve, and the ad spend it took to win the sale. If you do not know that number for every ASIN, you do not know which products fund your business and which ones quietly drain it.
This is the part most sellers get wrong. They treat unit economics as accounting, something the bookkeeper handles after the quarter closes. It is not accounting. It is the operating system underneath every PPC bid, every price change, every reorder, and every listing decision. When you set a bid, you are spending contribution margin. When you cut a price, you are spending contribution margin. Every lever in the business is denominated in this one currency, and most operators are flying without the gauge.
This playbook is the operator framework I run for myself and for the brands I work with. It assumes you want to run on profit, not revenue, and need the math to actually do it.
## Key takeaways >- Revenue is vanity. Contribution margin per unit is the only number that tells you whether an ASIN funds the business or drains it.- Every Amazon sale passes through a stack of deductions (referral fee, FBA fee, landed COGS, returns reserve, storage, ad cost). The price on the listing is not the money you keep.- TACoS, not campaign ACoS, tells you whether your ad spend is actually building the business or just renting sales.- Break-even is the floor under every PPC, pricing, and inventory decision. Operating without it means you are guessing where the cliff is.- The operator who reads their Amazon business like a CFO (per-unit, per-ASIN, after every cost) makes different decisions than the one who reads the Seller Central sales dashboard.
Revenue feels like progress because it goes up when you do more. Run a promo, revenue goes up. Add a campaign, revenue goes up. Drop the price, revenue goes up. None of those moves tell you whether you made money, and three of them often mean you lost it.
I have watched brands scale from 3M to 8M in revenue and shrink in profit. The extra 5M came from products with thin margins, promos that gave away the contribution, and ad spend that bought sales at a loss to chase a topline number. The revenue chart looked like a victory. The bank account told a different story.
The fix is not complicated. It is just unglamorous. Track contribution margin per unit, per ASIN, after every cost that scales with the sale. The ASINs that produce real per-unit margin are the business. The ones that do not are a hobby you are subsidizing with the good ones.
From reading to action
If the framework above sounds familiar, your Amazon account is probably carrying the same drag. Apply and we will show what Marko, Oracle, and Bruno would change in your first week.

Ran a 7-figure Amazon brand for a decade. Founded Skubana (acquired). Co-founded Prosper Show. 15+ years on Amazon.
Join the brands that replaced agencies and tools with AI employees.
Contribution margin per unit is the price you charge minus every cost that scales with one sale. Not allocated overhead. Not your salary. The costs that exist because that specific unit sold.
The stack, for a typical FBA private label unit:
What is left is contribution margin per unit. That is the money the unit actually contributed to covering your fixed costs and producing profit. The contribution margin per unit deep-dive walks through the full calculation with worked examples.
The reason this matters operationally: every lever you pull is denominated in contribution margin. A bid is contribution margin you spend to acquire a sale. A price cut is contribution margin you give away to win volume or the Buy Box. A reorder is contribution margin you are betting will materialize. If you do not know the per-unit number, every one of those decisions is a guess.
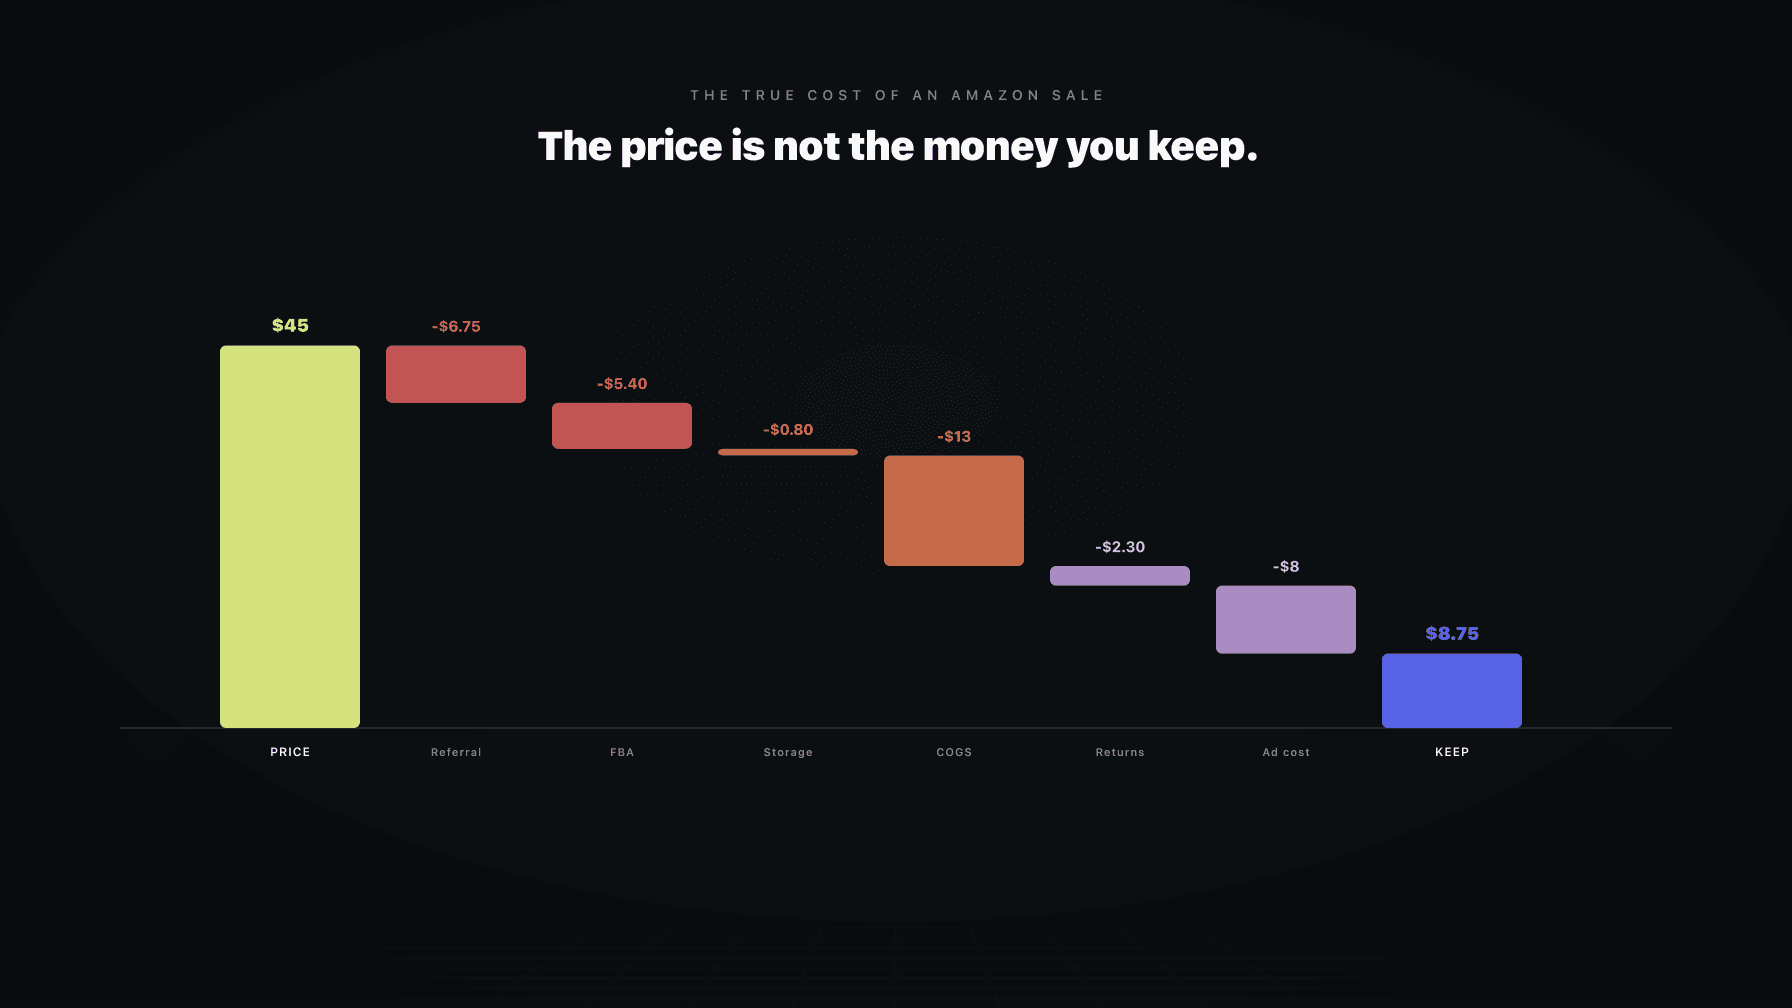
The single biggest reason sellers misjudge their economics is that they think of the listing price as their money. It is not. It is the top of a waterfall, and a lot leaks out before anything reaches you.
The deductions, roughly in order:
A unit that looks like a 40 percent margin on price often lands at 12 to 18 percent contribution margin after the full stack. The true cost of an Amazon sale post itemizes every fee and the ones sellers forget.
Campaign ACoS tells you what a campaign spent relative to the sales that campaign drove. It is a useful tactical number. It is a misleading strategic one, because it ignores the organic sales your ad spend is supposed to be building.
Total ACoS, or TACoS, measures total ad spend against total revenue, paid and organic. It answers the question that actually matters: is the ad spend building a business that throws off organic sales, or is it renting sales that disappear the moment you stop paying?
A healthy brand sees TACoS trend down over time as organic rank compounds. A brand in trouble sees TACoS flat or rising while campaign ACoS looks fine, because the ads are propping up sales that are not building anything underneath. The TACoS deep-dive covers how to read it and what a healthy trend looks like by product lifecycle stage.
This connects directly to the PPC playbook. A bid is only worth making if the contribution margin on the resulting sale exceeds the ad cost. Campaign ACoS cannot tell you that. Contribution margin per unit can.
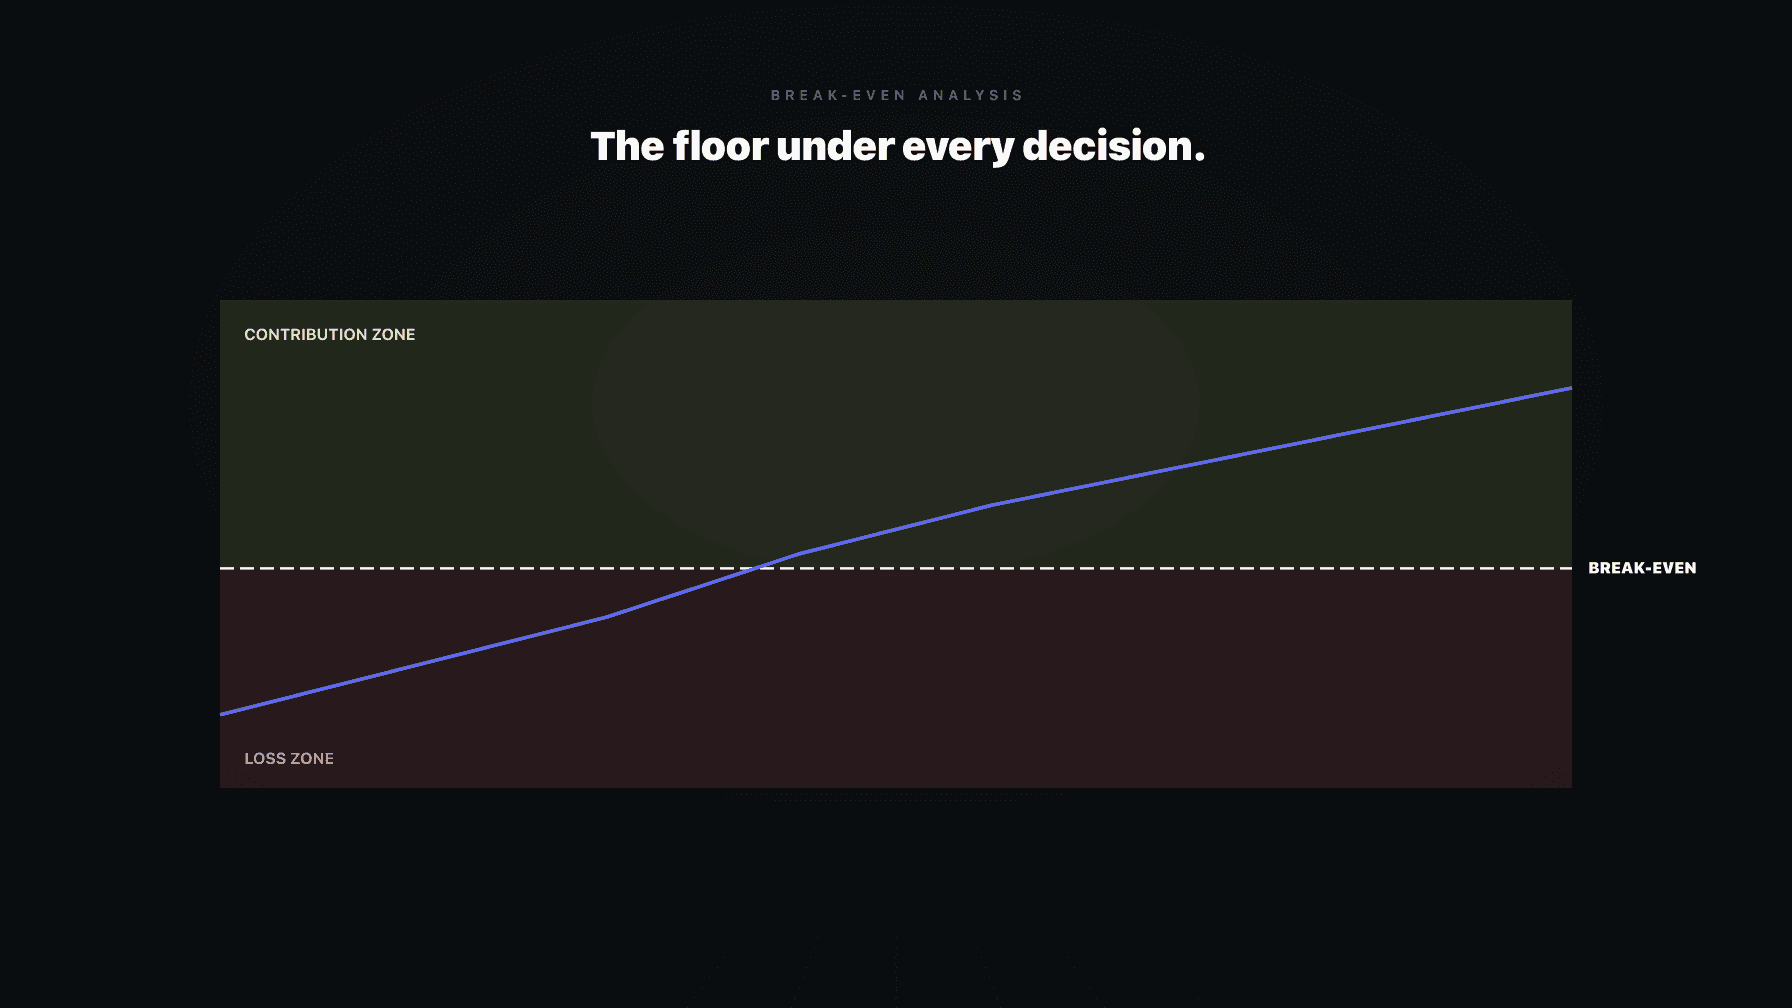
Break-even is the price at which contribution margin per unit hits zero. Below it, every sale loses money. Above it, every sale contributes. It sounds obvious. Most sellers cannot tell you their break-even price per ASIN off the top of their head, which means they are making pricing and bidding decisions without knowing where the cliff is.
Break-even is the floor for three different decisions:
The break-even analysis deep-dive gives the operator formulas and the worked examples.
The Seller Central dashboard shows you sessions, units, and sales. It does not show you contribution margin per unit, TACoS trend, or per-ASIN profit after the full fee stack. So operators who run off the dashboard make dashboard decisions: chase sessions, chase units, chase sales.
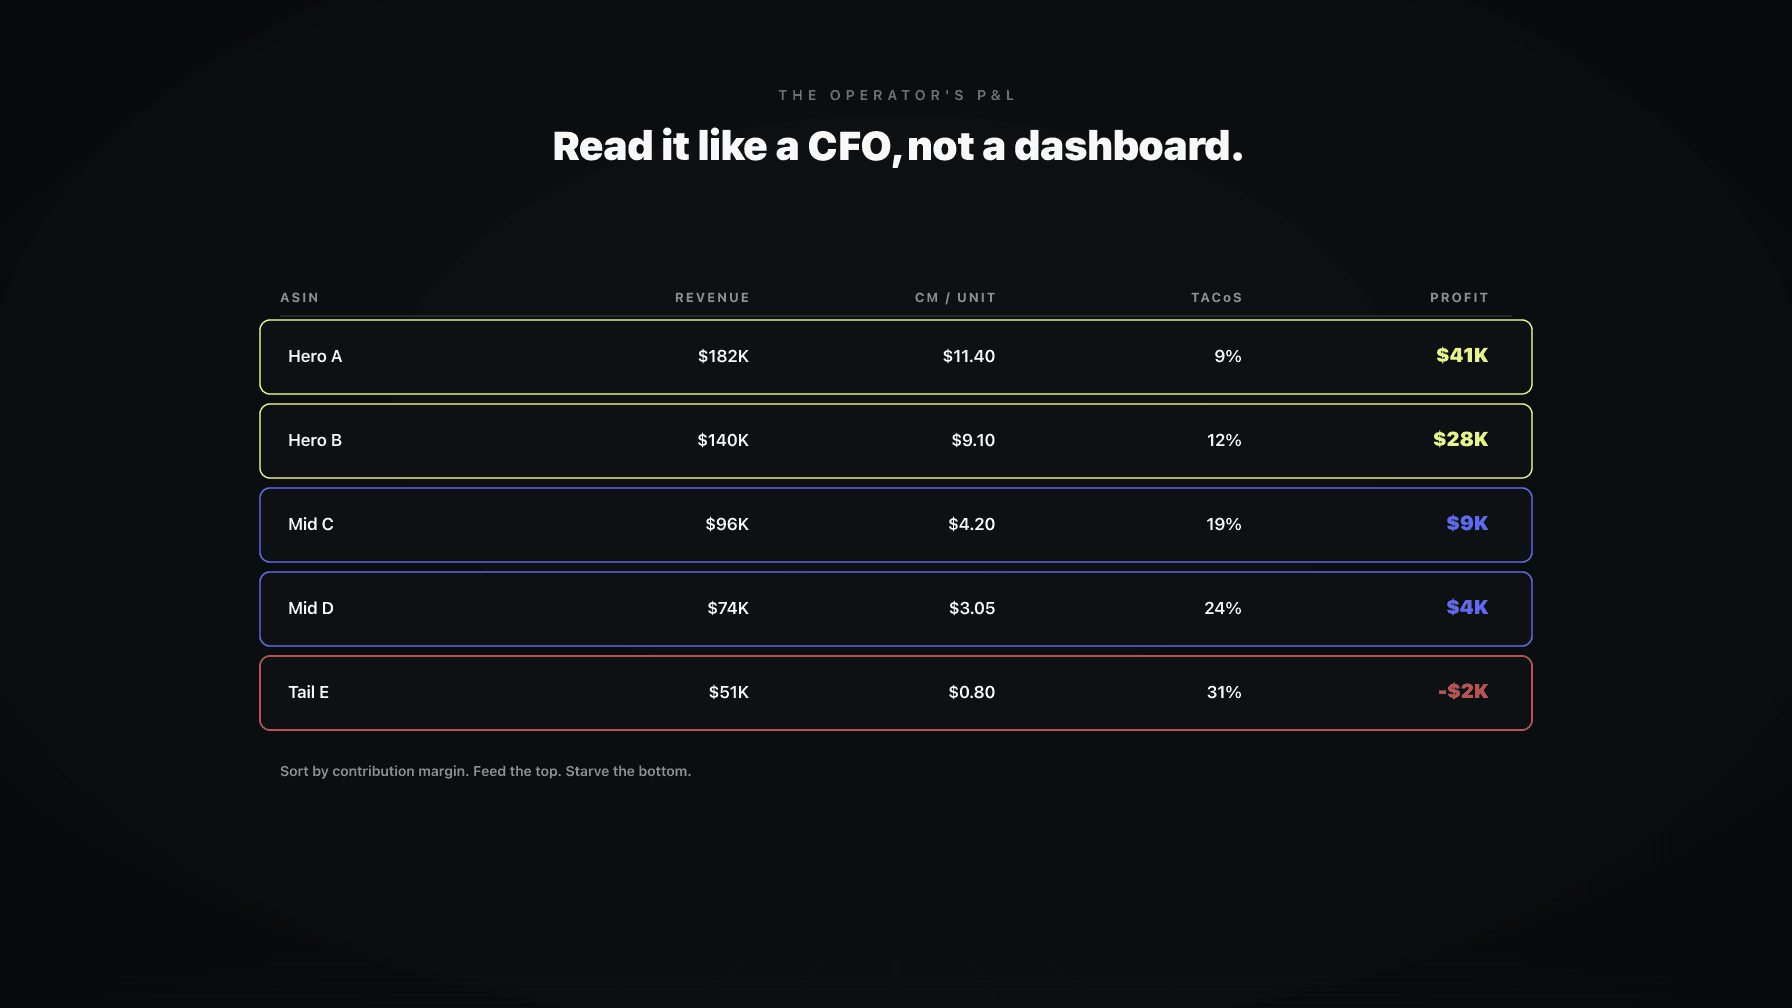
The operator who reads the business like a CFO asks different questions. Which ASINs produce the most contribution margin per unit, not the most revenue? Which ones have a rising TACoS that signals trouble? Which ones are below break-even after the latest FBA fee increase? Where is cash tied up in slow-moving inventory that is bleeding storage fees?
Those questions produce a different set of actions. Cut the ASINs that drain. Feed the ones that fund. Reprice the ones that drifted below break-even when fees rose. The P&L operator guide shows how to build the per-ASIN view that makes this possible.
Here is the thing that ties this whole blog together. Every operating lever on Amazon is denominated in contribution margin per unit.
This is why a brand that runs PPC, pricing, inventory, and catalog as separate functions leaks money. Each function optimizes its own metric (ACoS, Buy Box, days of cover, CTR) without seeing the shared currency underneath. The brand that runs them as one system, denominated in contribution margin, makes coherent decisions. That is the coordination thesis the rest of the site argues, viewed from the money side.
Failure 1: Optimizing revenue instead of contribution margin. Scaling the topline with thin-margin SKUs, loss-leader promos, and unprofitable ad spend. The revenue chart goes up. The business goes nowhere.
Failure 2: Ignoring the full fee stack. Calculating margin on price minus COGS minus FBA, forgetting referral, returns, storage, and ad cost. The number looks healthy and is not.
Failure 3: Reading campaign ACoS instead of TACoS. Believing the ads are profitable because each campaign looks fine, while total ad spend as a share of revenue climbs and organic never compounds.
These are not edge cases. They are how most brands accidentally run at a loss while believing they are winning.
Daily review is too granular for unit economics. Weekly is fine for exception monitoring. Monthly is right for the real review.
What goes in a monthly unit-economics review:
This is where the operator decides what to feed and what to starve. Not the AI. The AI executes against the contribution-margin targets the operator sets.
The agents we built at Profasee all operate in the same currency: contribution margin per unit. Oracle sets price against a true break-even that includes the full fee stack, not COGS plus FBA. Marko bids against contribution margin, so a bid is only made when the margin on the resulting sale clears the ad cost. Bruno weighs the contribution margin at risk in a stockout against the cash tied up in overstock.
Loading real COGS and the full fee stack is the prerequisite. Wrong inputs mean every agent optimizes against a false floor. Right inputs mean the whole system runs on the truth. Coordination across the agents is what keeps every lever denominated in the same currency, which is the difference between a coherent operation and four functions leaking margin in different directions.
Unit economics is the per-unit profit and cost structure of your products: the contribution margin that survives after every cost that scales with a single sale (referral fee, FBA fee, landed COGS, returns reserve, ad cost). It is the operating layer underneath every PPC, pricing, inventory, and catalog decision, because every lever is denominated in contribution margin per unit.
Contribution margin per unit is the sale price minus every cost that scales with that one sale: Amazon referral fee, FBA fulfillment fee, landed cost of goods, returns reserve, and the ad cost it took to win the sale. It is the money the unit actually contributed toward fixed costs and profit, and it is the only reliable signal of whether an ASIN funds the business or drains it.
Revenue goes up whenever you do more, regardless of whether the activity made money. Promos, added campaigns, and price cuts all raise revenue and often lower profit. Brands routinely scale revenue while shrinking profit by adding thin-margin SKUs and loss-leader ad spend. Contribution margin per unit is the metric that distinguishes growth from churn.
Campaign ACoS measures ad spend against the sales that campaign drove. TACoS (total ACoS) measures total ad spend against total revenue, paid plus organic. ACoS is a tactical number. TACoS is the strategic one: it tells you whether your ad spend is building organic rank that compounds, or just renting sales that vanish when you stop paying.
Break-even is the price at which contribution margin per unit hits zero. Add up every cost that scales with the sale (referral fee, FBA fee, landed COGS, returns reserve, ad cost) and that sum is your break-even price. Below it, every sale loses money. Your repricer floor should sit at break-even plus your minimum acceptable contribution margin.
The most commonly forgotten costs are the returns reserve (return rate times cost per return), monthly and long-term storage fees, aged-inventory surcharges, and the per-unit allocation of ad spend. Many sellers calculate margin as price minus COGS minus FBA fee and stop there, which overstates real contribution margin by 10 to 25 points.
Monthly for the real review: contribution margin per unit by ASIN, TACoS trend, break-even after any fee change, and cash tied up in slow inventory. Weekly is fine for exception monitoring. Recalculate break-even immediately after any Amazon referral or FBA fee increase, because those changes silently push marginal ASINs below the line.