Chad Rubin
June 28, 2026 · 12 min read
Operator notes by email
Short, opinionated takes on AI agents, Amazon PPC, pricing, and inventory. No fluff. About once a week.
A founder calls me. He is celebrating. Walmart launched 90 days ago and is now doing $50,000 a month in revenue. He sends me a screenshot of his Walmart Seller Center. He wants to talk about expanding to Target next.
I ask him one question. What happened to your Amazon contribution margin over the same 90 days?
Silence. Then: "I think it's fine. Amazon revenue is about the same."
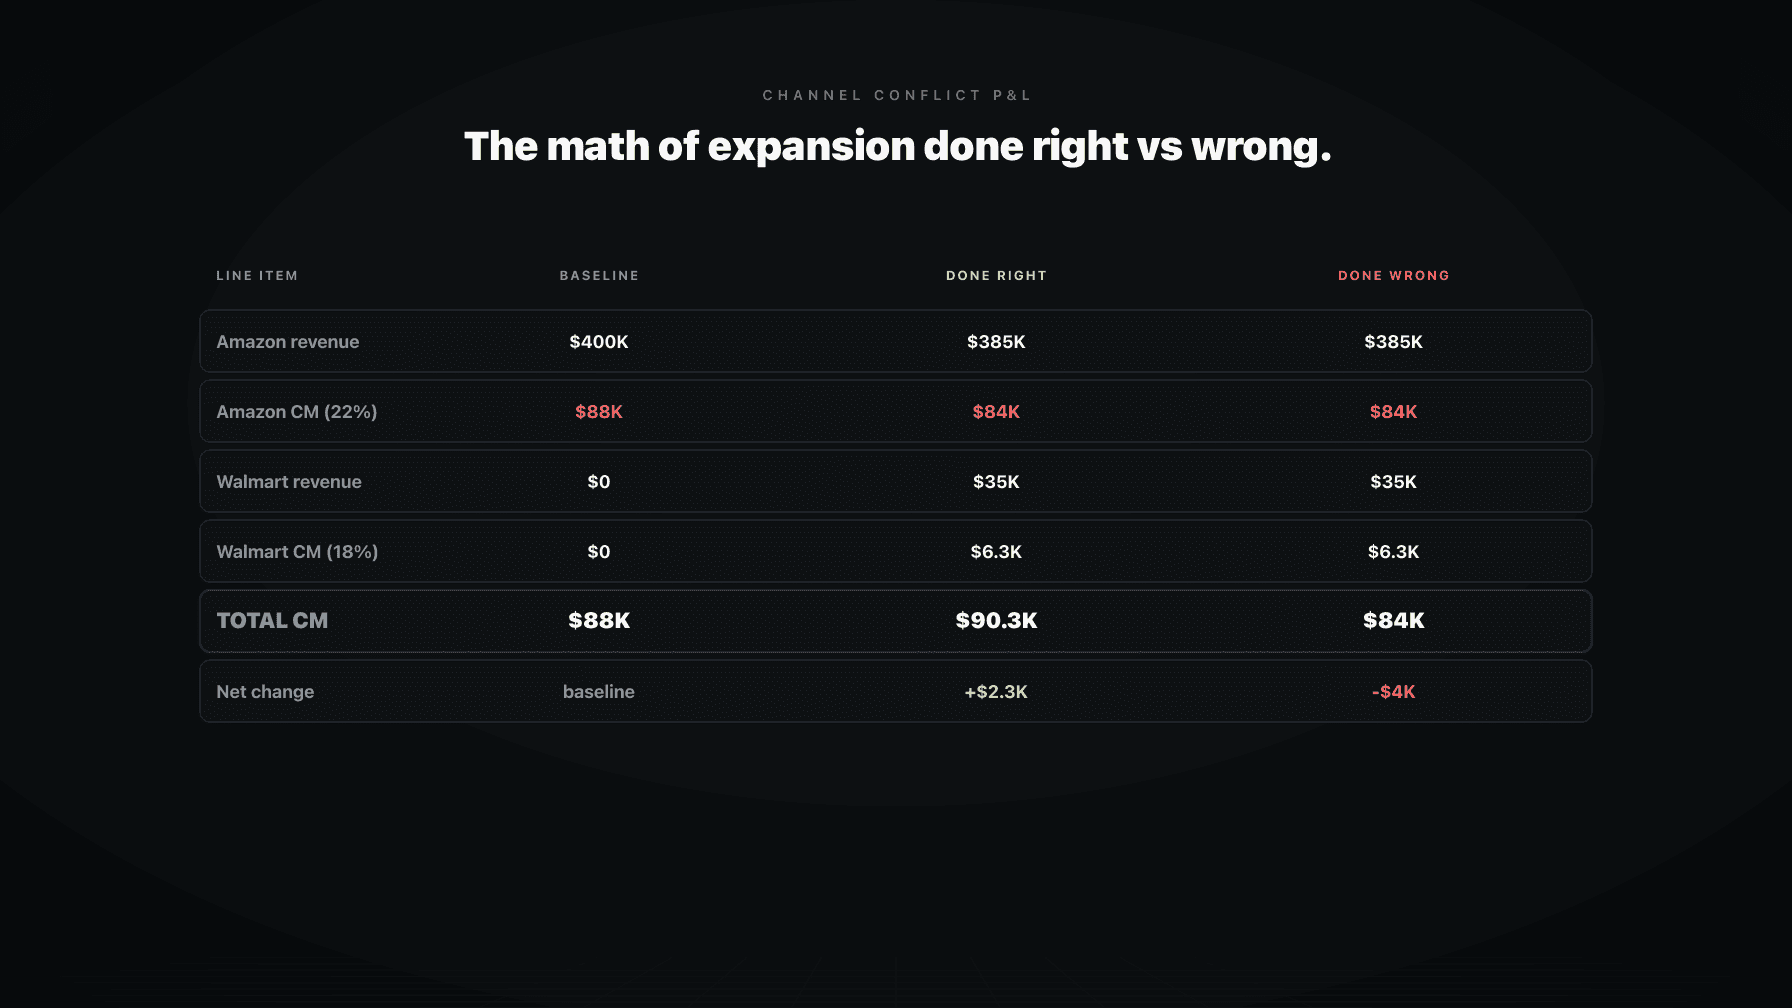
Amazon revenue being "about the same" is exactly the trap. We pulled his Amazon P&L. Revenue was flat at $400,000 a month. Contribution margin had dropped from 22% to 17%. That is $20,000 a month in lost contribution margin. The Walmart channel was producing $50,000 in revenue at an 18% contribution margin, which is $9,000 a month in contribution margin dollars.
The arithmetic: he gained $9,000 in Walmart contribution margin and lost $20,000 in Amazon contribution margin. His Walmart expansion was an $11,000 a month loss disguised as a $50,000 a month revenue win. His revenue dashboard told him he was growing. His P&L, properly constructed, told him he was bleeding.
This is the most expensive blind spot I see in operator-led brands. They evaluate channel expansion on revenue ("does it add a revenue stream?") when the only question that actually matters is total contribution margin across all channels. If you are running a brand and considering Walmart, Target, TikTok Shop, DTC, or any second channel, you do not get to skip this math. The multi-marketplace trap eats brands that skip it.
This post is the model. Four columns, a worked example, the suppression line items most brands forget to include, and how to read the output like a Steward of Capital instead of a marketer chasing a logo.
The model is a spreadsheet with four columns. Anything less than four columns and you are flying blind. Anything more is fine, but you cannot skip any of these.
Column 1: Pre-expansion Amazon baseline. This is your Amazon P&L the month before you launched the second channel. Revenue, COGS, Amazon fees (FBA, referral, storage), advertising spend, returns reserve, allocated overhead, contribution margin in dollars, contribution margin as a percent. If you do not have this baseline, you have nothing to compare against, and you will lose the argument with yourself six months from now when you are trying to figure out if the expansion worked. Lock the baseline. Save the spreadsheet with a date.
Column 2: Post-expansion Amazon. Same rows as Column 1. Same ASINs. But now reflecting reality after the second channel went live. This column is where most brands lie to themselves. They put the same numbers as Column 1 because Amazon revenue looks "about the same." It is not the same. You must capture every suppression effect: Buy Box win rate change, conversion rate change, organic rank change, PPC efficiency change, return rate change. We will go through each of those in the next section.
From reading to action
If the framework above sounds familiar, your Amazon account is probably carrying the same drag. Apply and we will show what Marko, Oracle, and Bruno would change in your first week.

Ran a 7-figure Amazon brand for a decade. Founded Skubana (acquired). Co-founded Prosper Show. 15+ years on Amazon.
Join the brands that replaced agencies and tools with AI employees.
Column 3: New channel. Revenue, COGS (often higher per unit because of lower volume), channel fees (Walmart is roughly 8 to 15% referral, plus WFS fulfillment if applicable), advertising spend on the new channel, returns, allocated overhead. Contribution margin in dollars and percent. Be honest about overhead. If you hired a Walmart manager at $80,000 a year, that is $6,667 a month coming out of Walmart contribution margin. If you bought scraping software to watch Walmart pricing, that is in there too. See Amazon price scraping and Walmart/Target for the tooling angle.
Column 4: Total. Sum of Column 2 and Column 3. Compare to Column 1. This is the only number that matters. If Column 4 contribution margin in dollars is greater than Column 1 contribution margin in dollars, the expansion is working. If it is equal or less, the expansion is a failure regardless of how the new channel looks in isolation. There is no other definition of success.
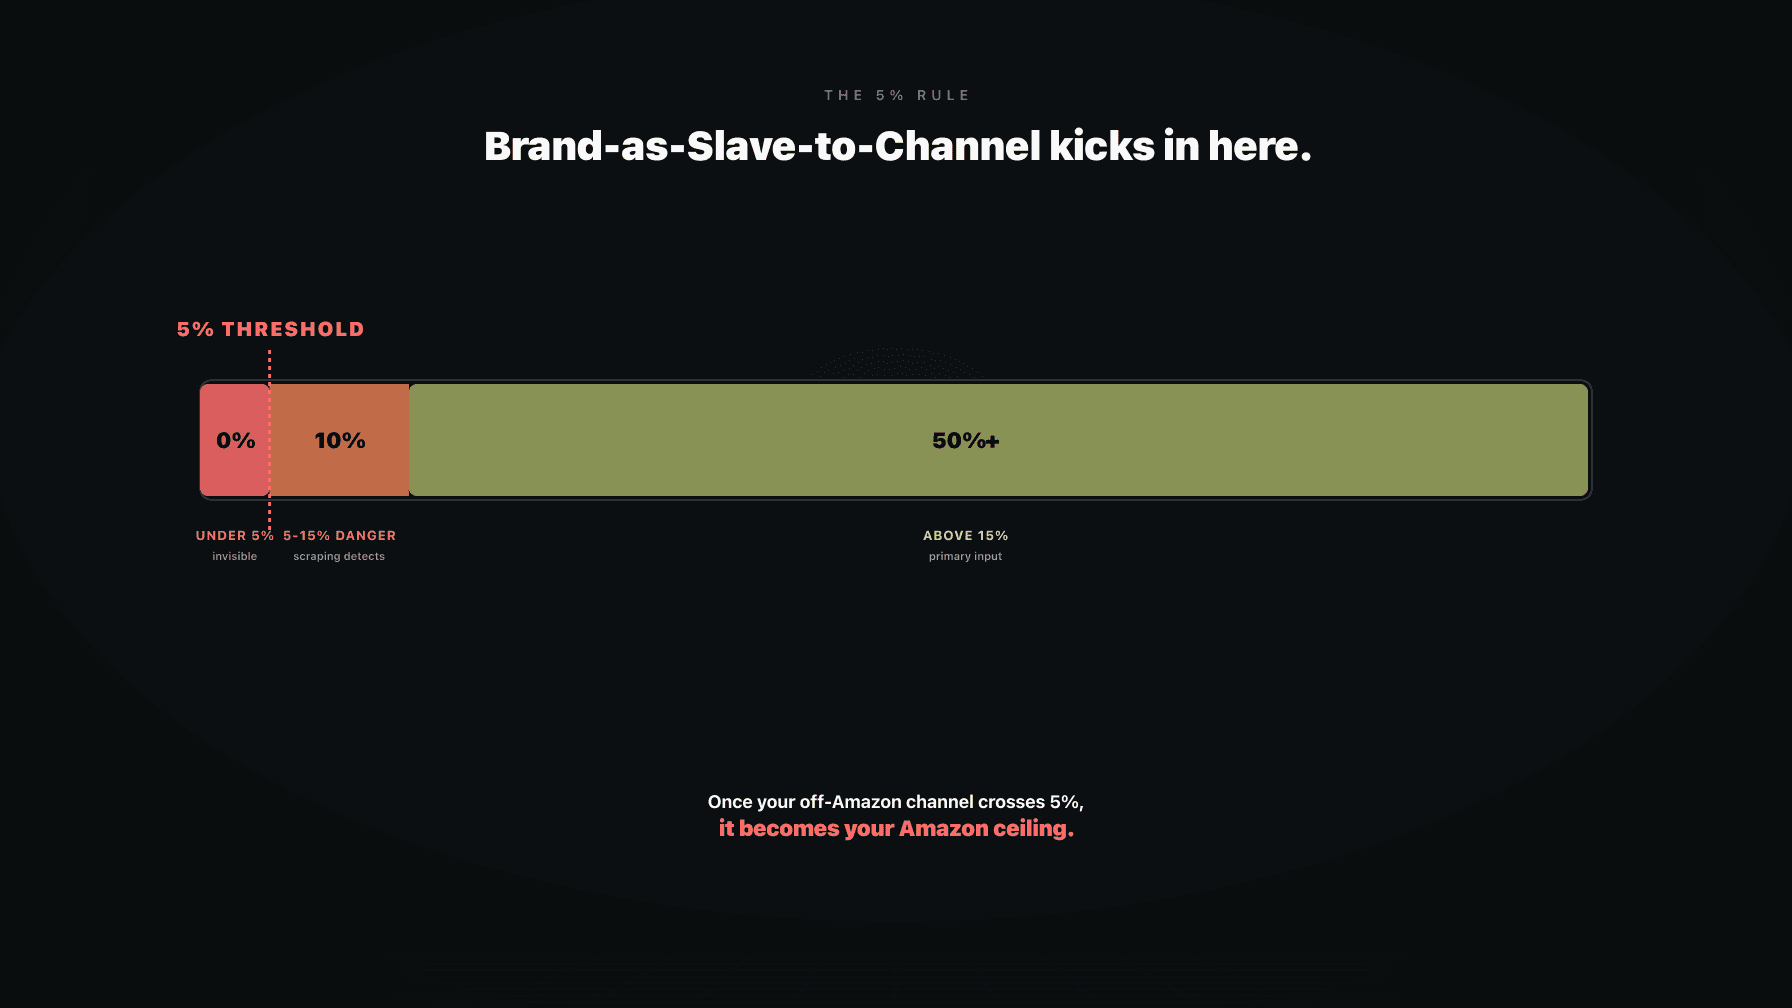
A brand that adds $50,000 in Walmart revenue but ends Column 4 below Column 1 has not expanded. It has rearranged its P&L into a worse configuration with more operational complexity, more SKU management, more customer service surface area, and lower total contribution margin. That is the channel slave problem playing out in real time.
The discipline of building all four columns is the discipline that separates operators from marketers. Marketers will fight you on Column 2 because it makes their initiative look bad. Operators will fight for Column 2 because they know it is the only honest column.
Column 2 is where the model lives or dies. Most brands underestimate Amazon suppression by 5 to 10x because they only look at one effect when there are at least five. Here is the full list.
Buy Box win rate change. The moment Walmart shows a lower price on the same UPC, Amazon's algorithm notices. Buy Box win rate on the affected ASINs typically drops 15 to 30 points within 30 days. If you were winning Buy Box 95% of the time and you drop to 70%, your conversion rate on those listings drops roughly 20% because shoppers who land on the listing without the Buy Box convert at a fraction of the rate. On an ASIN doing $20,000 a month, a 20% conversion drop is $4,000 a month in lost revenue. Multiply across 20 affected ASINs and you are looking at $80,000 a month in suppression on the Amazon side alone. This single line item is bigger than the entire Walmart contribution margin in most expansions I audit.
Organic rank change. Conversion rate is one of the two strongest inputs to Amazon's organic ranking algorithm. When conversion drops, rank drops. When rank drops, impressions drop. When impressions drop, units drop even further, which drops conversion velocity further, which drops rank further. This is a flywheel and it spins both directions. A 20% conversion drop in month one becomes a 35% unit drop by month four because of rank decay. Rank decay does not show up in your Column 2 in month one. You have to model it as a 6-month run rate, not a snapshot.
PPC ACoS change. Lower conversion rate at the same bid means higher ACoS. If your conversion drops 20%, your ACoS rises roughly 25% to hold the same sales velocity. You can let ACoS rise (which eats contribution margin) or you can cut bids (which drops PPC volume and accelerates the organic rank decay). Both choices cost money. Brands often think they have a third option ("we will just optimize harder") and they do not. The math is the math. See Amazon unit economics for how PPC sits in the unit P&L.
Total Amazon revenue change. This is the line item brands actually look at, and they usually look at it wrong. They look at total Amazon revenue. But suppression does not hit all ASINs equally. It hits the ASINs that you also listed on Walmart. The rest of your Amazon catalog is unaffected. So total Amazon revenue can look flat because your 180 non-Walmart ASINs are stable while your 20 Walmart-overlap ASINs are bleeding 25 to 40% of their volume. You have to model suppression at the ASIN level, not the account level, or you will miss it entirely.
Return rate change. Walmart shoppers and Amazon shoppers return at different rates for the same product. When you push price-sensitive shoppers to Walmart and keep brand-loyal shoppers on Amazon, the customer mix on each channel shifts. Sometimes returns go up. Sometimes they go down. You will not know until you have 60 days of data. Model a 1-point return rate change either direction as a sensitivity in Column 2.
If you only put "Amazon revenue" in Column 2 and call it a day, you have already lost. The line items above are the ones that hide the real damage. Run all five. Run them at the ASIN level. Run them on a 6-month projection, not a 30-day snapshot. The contribution margin per unit framework is the unit-level lens you need.
Let me run the actual numbers. Same brand I described in the opening, but with the model built out.
Column 1: Pre-expansion Amazon baseline.
Walmart launch. Same UPCs as Amazon. The marketing team pushes for an 8% lower Walmart price to "win the channel." 20 ASINs go live on Walmart at the lower price. The rest of the catalog stays Amazon-only.
Column 3: Walmart.
So far Walmart looks fine in isolation. $6,300 in fresh contribution margin. The marketing team starts updating the deck.
Column 2: Post-expansion Amazon. The 20 overlap ASINs lose 25% of their volume because of Buy Box and conversion suppression. Those 20 ASINs were $200,000 of the original $400,000. A 25% volume loss is $50,000 in lost monthly revenue.
Then we apply the rank decay over the 6-month horizon. Those same 20 ASINs lose another 15% of volume from organic rank slippage by month 6. That is another $30,000 in revenue, another $6,600 in contribution margin.
Column 4 at month 1: $77,000 Amazon + $6,300 Walmart = $83,300 total contribution margin. Versus $88,000 baseline. Net: down $4,700 a month.
Column 4 at month 6: $70,400 Amazon + $6,300 Walmart = $76,700 total contribution margin. Versus $88,000 baseline. Net: down $11,300 a month.
The brand looks at month 1, sees Walmart at $35,000 in revenue, and declares victory. The reality is that the expansion destroyed $4,700 a month in contribution margin in month 1 and will be destroying $11,300 a month by month 6. That is $135,000 a year in destroyed contribution margin in exchange for a Walmart logo on the deck.
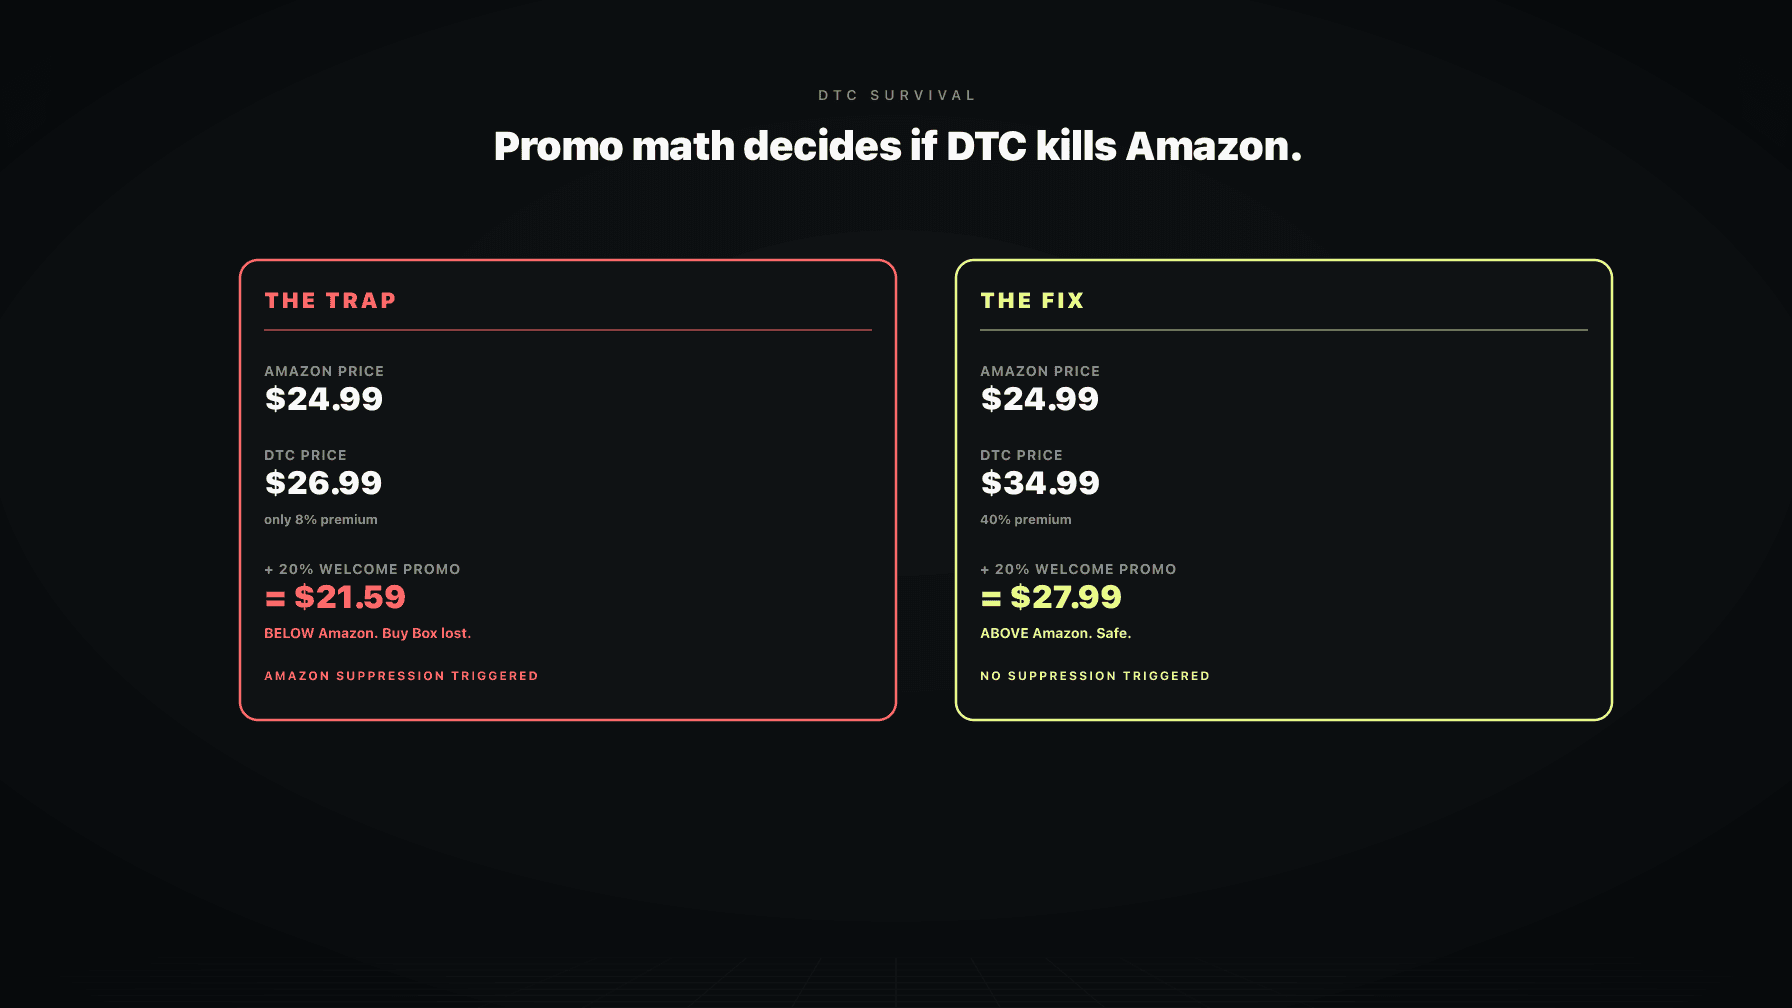
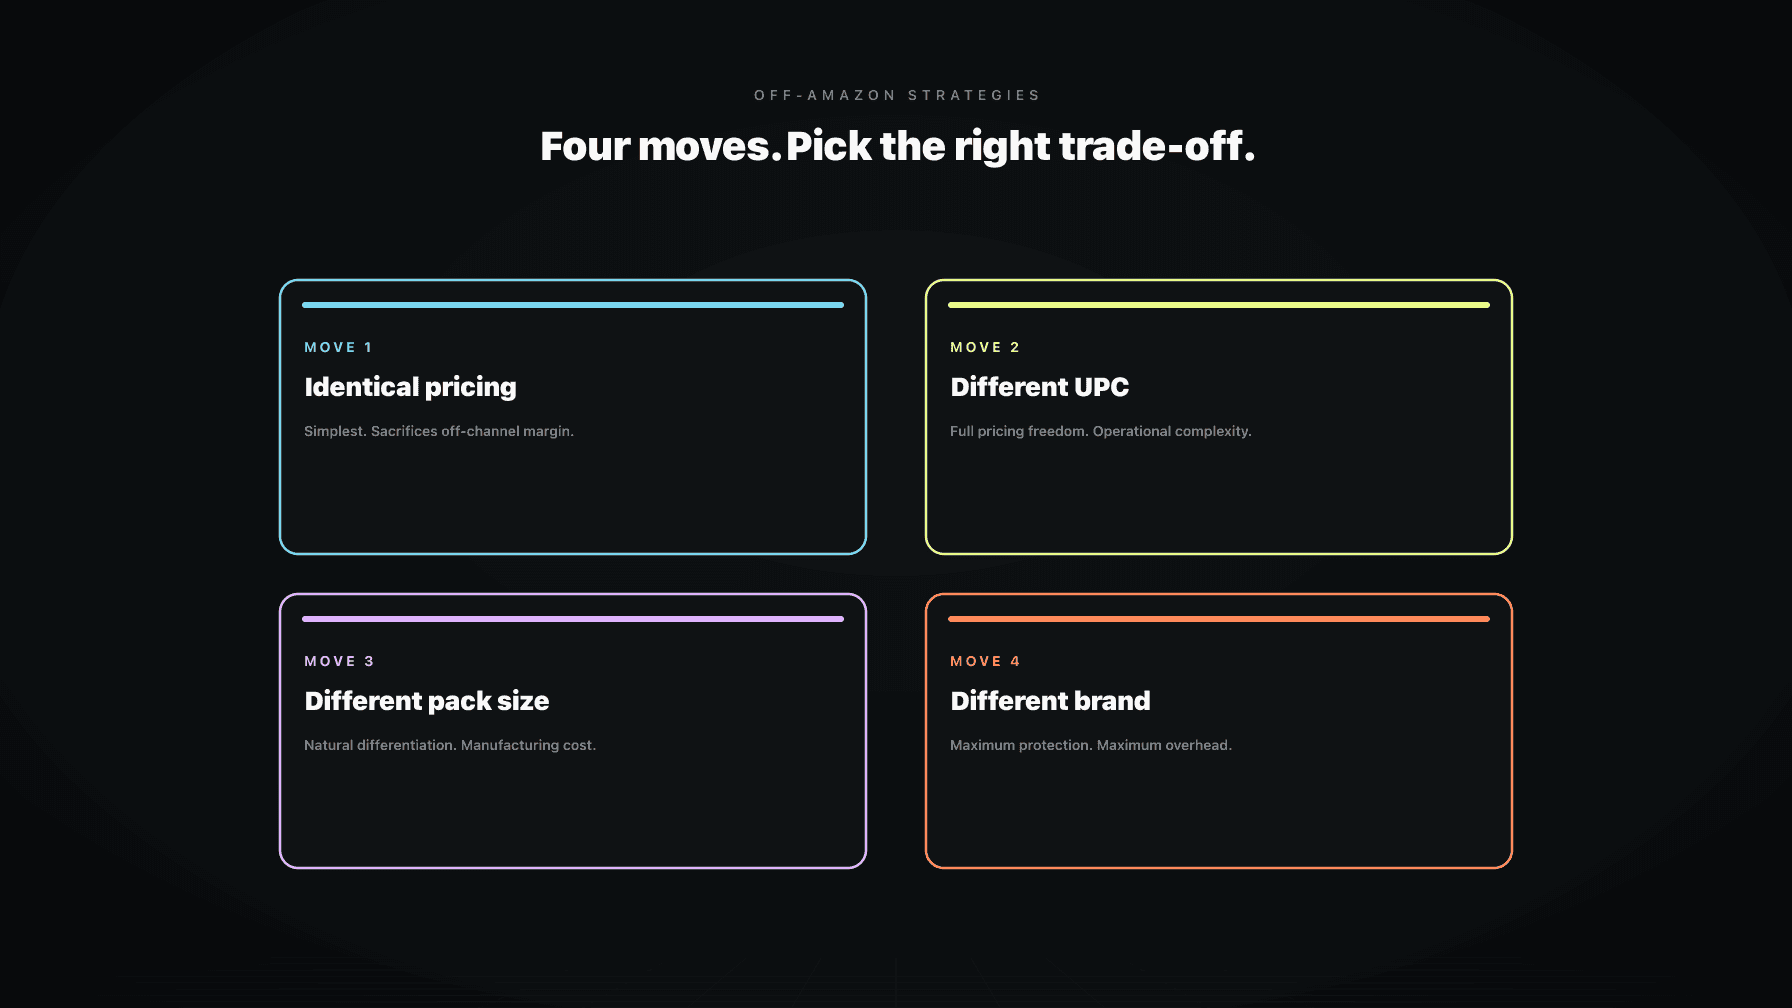
Now run the same expansion with the architecture fixed. Different UPCs on Walmart. Different pack count, different bundle, anything that breaks the Amazon-Walmart price comparison crawl. Amazon suppression goes to zero. Walmart contribution margin stays at $6,300 a month.
Column 4 with the architecture fix: $88,000 Amazon + $6,300 Walmart = $94,300. Net: up $6,300 a month.
Same launch. Same product. Same Walmart team. The architecture decision (UPC strategy) turned a $135,000-a-year destruction into a $76,000-a-year creation. That is a $211,000 a year swing on a single decision that most brands make on a 30-minute call with a Walmart rep. Read off-Amazon without breaking margins for the architecture playbook.
If you ever sell the brand, the diligence team will reconstruct exactly this P&L. Every aggregator and strategic buyer I have ever sat across from in a diligence room has built a version of the four-column model on your numbers. They will pull your Amazon brand analytics, your Walmart Seller Center reports, your DTC Shopify exports, and they will rebuild your contribution margin by channel for the trailing 24 months.
Brands that did multi-channel poorly get marked down. The diligence team finds the suppression. They find the rank decay. They model the run-rate erosion. They discount the multiple. A 4.5x multiple becomes a 3.2x multiple, and the founder finds out in the LOI that the Walmart expansion they bragged about for three years actually cost them $2 million in enterprise value.
Brands that did multi-channel well get credit. The diligence team finds that Amazon held its baseline, Walmart was incremental, DTC was incremental, the architecture decisions were intentional, and the contribution margin actually compounded. The multiple holds. Sometimes it expands because the brand demonstrated channel discipline that the buyer can replicate across their portfolio.
The math is permanent. You cannot un-decay rank. You cannot un-train Amazon's algorithm to suppress your Buy Box. You cannot un-erode the contribution margin you destroyed in months one through twelve. Future cohorts of buyers will see the trailing-twelve numbers and price the brand accordingly. The Steward of Capital frame treats every channel decision as a permanent entry on a permanent balance sheet, because it is.
Revenue is vanity. Total contribution margin across all channels is sanity.
A marketer reads the model and says "Walmart added $50,000 a month and our Amazon revenue is fine, ship it." A Steward of Capital reads the same model and asks, "what is the net total contribution margin in Column 4 versus Column 1 over a 6-month projection?" Different question. Different answer. Different outcome.
The marketer is incentivized by channel diversity, new logos, new initiatives, optics for the board deck. None of that pays the bills. Contribution margin pays the bills. Contribution margin funds inventory. Contribution margin funds the next product launch. Contribution margin determines what the brand sells for in three years. A channel that adds revenue and subtracts contribution margin is a tax on the future of the business, paid quarterly, forever, until you reverse it.
The frame I trained myself to use after fifteen years of getting this wrong: every channel decision is a contribution margin question first and a revenue question never. Read the Steward of Capital post for how this applies across the whole P&L, and the DTC survival playbook for the DTC-specific version of the same math.
If you are sitting on a Walmart, Target, or DTC expansion decision right now and you do not have the four-column model built, stop. Build the model first. If you want a second set of eyes on the math before you commit, apply to work with us and we will run the projection alongside you. The math takes a day. The recovery from skipping it takes years.
Build the four-column P&L: pre-expansion Amazon baseline, post-expansion Amazon (with suppression modeled at the ASIN level), new channel revenue and margin, and total. Project six months out, not one. If total contribution margin in Column 4 does not exceed Column 1 by a meaningful margin within six months, the expansion is not worth running. The model takes a day if you have your Amazon and proposed channel numbers in front of you.
The new channel needs to produce enough contribution margin in dollars to cover all Amazon suppression effects plus produce a positive surplus that justifies the operational complexity. As a rule of thumb, the new channel should add at least 1.5x the suppression dollars on the Amazon side, on a 6-month projection. If Amazon suppression costs you $10,000 a month, the new channel needs to clear $15,000 a month in contribution margin before you call it a win. Anything less and you are running a more complex business for less money.
Suppression has five line items: Buy Box win rate change, conversion rate change, organic rank decay, PPC ACoS change, and return rate change. Model each at the ASIN level for the SKUs that overlap with the new channel. Project rank decay over six months because it compounds. Do not model suppression on ASINs that are not on the new channel. The non-overlap catalog is unaffected.
Yes. Rank decline is one of the biggest hidden costs because it compounds. A 20% conversion drop in month one usually becomes a 30 to 40% unit drop by month six because of rank slippage. If you only model the month-one effect, you will understate suppression by 50% or more. The 6-month run-rate is the honest number.
That is the most common pattern, and it usually means the expansion is a slow loss disguised as a flat outcome. Break-even today becomes negative in month six because of rank decay. Either restructure the architecture (different UPCs, different pack counts, different bundles) to remove the suppression, or pull the expansion. Holding a break-even position while operational complexity compounds is a tax you pay every month with no upside.
Sometimes. The fastest move is to restore Amazon price parity by raising the new channel price, then change the new channel listing structure (UPC, bundle, pack count) so Amazon's algorithm stops cross-referencing them. Rank decay takes 4 to 8 weeks to start reversing after you fix the conversion driver. Some brands recover fully. Some recover partially. The ones that wait twelve months to act usually do not recover. Move fast.
Show all four columns. Show the 6-month projection, not the month-one snapshot. Highlight the Amazon suppression line items in the post-expansion column. End with a single number: net change in total contribution margin dollars across all channels. Boards that have seen this format once never go back to revenue-only channel reporting. It is the operator P&L view applied to channel strategy, and it makes the answer obvious.
If you want help building the four-column model on your actual numbers before you commit to a channel expansion, apply to work with us. We will run the projection with you, identify the suppression risks, and tell you whether the math works before you spend a year finding out the hard way.