Chad Rubin
June 22, 2026 · 14 min read
Operator notes by email
Short, opinionated takes on AI agents, Amazon PPC, pricing, and inventory. No fluff. About once a week.
I am going to give you the single frame that decides whether your brand makes it through the next two years.
Your job is not to generate revenue. Your job is to generate revenue in relation to your budget. You are a steward of capital first and foremost.
I call this the Steward of Capital frame. It is the operator mindset that separates the brands that survive the Tightened phase of the Amazon capital cycle from the ones that quietly die inside it. And right now, in 2026, almost every Amazon brand owner I talk to is still running the wrong dashboard.
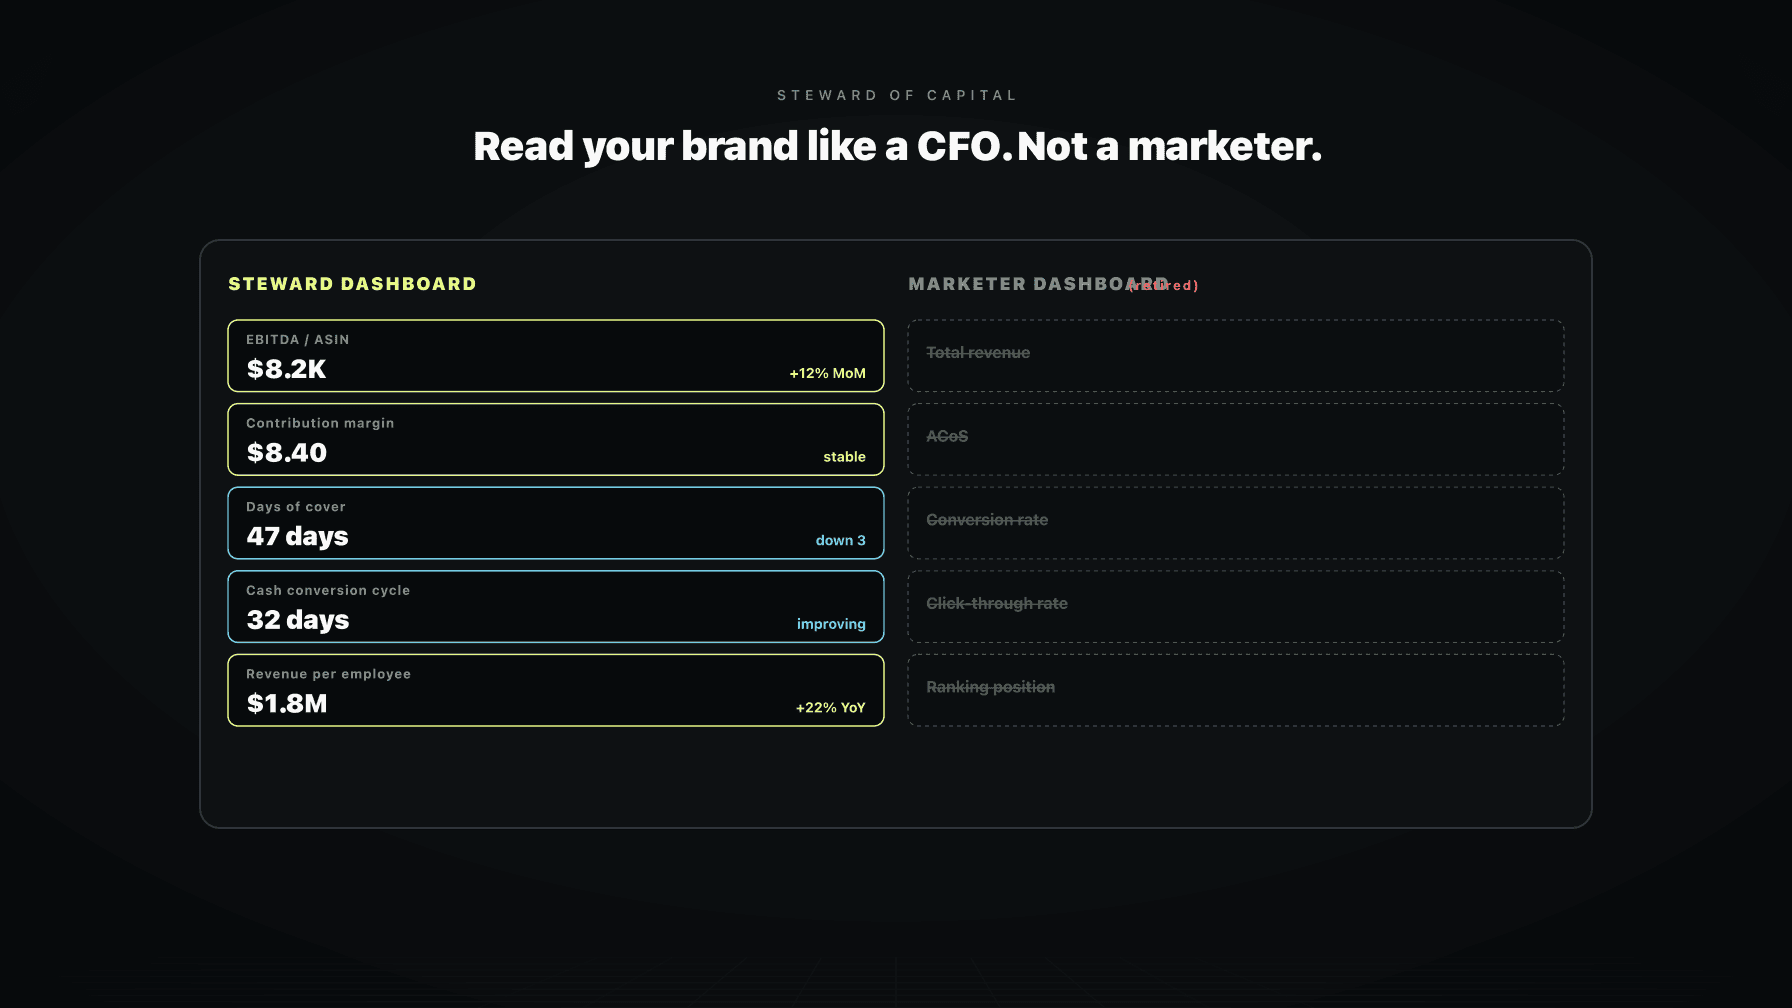
They are running a marketer dashboard. Revenue. ACoS. Conversion rate. Click-through. Ranking. Sessions. Best Seller Rank. Those numbers are not wrong. They are just not the numbers a steward of capital operates against.
A steward operates against EBITDA per ASIN. Contribution margin per unit. Days of cover. Cash conversion cycle. Revenue per employee. These are CFO instruments, not marketing instruments. They tell you whether the capital you deployed last month is coming back with a return, or whether it is sitting in a 3PL in Pennsylvania disguised as inventory.
The reason this matters so much in 2026 is that the macro has changed. The five phases of the Amazon capital cycle put us squarely in Tightened. Capital is no longer cheap. The aggregator buyers are gone. The patient bank line is gone. The "we will figure out profit later" era is gone. What is left is a market that pays for one thing: capital efficiency.
If you can't read a P&L, you can't run an Amazon brand. Not in this phase. The operators who win the next two years are the ones who can look at their catalog and tell you, in twenty seconds, which ASINs are generating EBITDA and which ASINs are stealing it. The marketer dashboard cannot answer that question. The CFO dashboard can.
This post is the operator's version of that CFO dashboard. The metrics, the cadence, the four questions, and the way AI agents make the whole thing practical at a catalog scale that used to require a finance team.
If you take one thing from this, take this: stop running a marketing department on top of an Amazon business and start running a holding company.
The marketer dashboard was built for a different market.
Revenue, ACoS, conversion rate, click-through rate, ranking position, sessions, units sold, Best Seller Rank. These are the instruments of a marketer. They measure attention, traffic, and rank. They are the right instruments when the question is "how fast can I grow."
In the Hot phase of the capital cycle, that was the question. Capital was cheap, aggregators were buying anything with a pulse, and the multiplier was on top-line growth. You could run a 35% ACoS, a 12% contribution margin, and 80 days of cover, and the market would still hand you 4x EBITDA on the way out the door. The marketer dashboard worked because the exit math forgave the operating math.
From reading to action
If the framework above sounds familiar, your Amazon account is probably carrying the same drag. Apply and we will show what Marko, Oracle, and Bruno would change in your first week.

Ran a 7-figure Amazon brand for a decade. Founded Skubana (acquired). Co-founded Prosper Show. 15+ years on Amazon.
Join the brands that replaced agencies and tools with AI employees.
That market is gone. The question has changed. It is no longer "how fast can I grow." It is "how much profit am I generating per dollar of capital I have deployed."
The marketer dashboard cannot answer that question. Here is what it hides.
A brand can post record monthly revenue, hit a target ACoS, and improve its ranking on the hero ASIN, while simultaneously burning capital. Revenue went up because the operator launched a deeper promo to clear aging inventory. ACoS hit target because the operator pulled budget off the second-tier ASINs that were actually generating contribution margin. Ranking improved because the operator overspent on Sponsored Brands to defend a slot that doesn't pay for itself. The marketer dashboard says "winning." The CFO dashboard says the brand burned $40,000 of working capital and added 22 days to its cash conversion cycle.
I have watched this exact story play out a hundred times. The operator is genuinely confused. "My numbers are great." The marketer numbers are great. The steward numbers are upside down.
A few specific ways the marketer dashboard misleads in Tightened:
It treats revenue as the goal instead of the input. Revenue is a means to EBITDA. If your revenue grew 18% and your EBITDA grew 2%, you have a problem, not a win. You just bought more revenue with less efficient capital.
It treats ACoS as a profit signal. ACoS is an advertising efficiency ratio. It tells you nothing about whether the unit underneath the ad is profitable. A 22% ACoS on a unit with a 9% contribution margin is a slow-motion fire. A 38% ACoS on a unit with a 31% contribution margin can be the best capital deployment in your catalog.
It ignores inventory as capital. The marketer dashboard treats inventory as a logistical input. The CFO dashboard treats it as the largest capital deployment most brands make. If you have $600,000 in inventory and 140 days of cover, you have $600,000 in capital sitting still. That is not a logistics problem. That is a return-on-capital problem.
It ignores the cash conversion cycle entirely. Marketers measure how fast a unit sells. Stewards measure how fast a dollar of capital becomes a dollar of cash. Those are different numbers.
In Tightened, those gaps are not academic. They are the difference between making payroll and not.
Here are the five metrics a Steward of Capital operates against. None of them are new. Every CFO in the world tracks variants of these. What is new is using them as the primary operating dashboard for an Amazon brand instead of the marketing scoreboard.
This is the single most important metric a steward tracks. Not total EBITDA. Not gross margin. EBITDA per ASIN, ranked from highest to lowest contributor, updated weekly.
Most Amazon catalogs follow a brutal Pareto distribution. The top 10% of ASINs generate 70% to 90% of the EBITDA. Another 30% generate the next 15%. And then there is a long tail that, when you actually load all the costs into it (PPC, returns, FBA fees, storage, chargebacks, allocated overhead), generates negative EBITDA.
A steward knows which ASINs are which. A marketer does not, because the marketer dashboard does not separate ad-driven revenue from profit-driven revenue at the ASIN level. The Amazon P&L operator guide walks through how to actually build this view per ASIN, including the costs most operators forget to allocate.
The decision rule is simple. You feed the top of the Pareto distribution with capital and attention. You hold the middle. You either fix or kill the bottom. In Tightened, the bottom of the distribution is where most brands quietly bleed to death.
Contribution margin per unit is the dollar amount a single unit contributes to EBITDA after every variable cost. Cost of goods, inbound freight, FBA fees, ad spend allocated, return reserve, referral fees, chargebacks. Everything that scales with the unit.
This is the number that tells you whether your unit economics actually work. I wrote a full breakdown in Amazon contribution margin per unit. The short version: if you do not know your contribution margin per unit on your top 20 ASINs to the dollar, you are not operating. You are guessing.
A steward looks at contribution margin per unit before every pricing decision, every PPC budget shift, every inventory reorder, every promo. A marketer looks at it once a quarter when the accountant asks.
Days of cover is how many days of sell-through your current inventory represents, per ASIN. It is the inventory health metric.
Too high (180+ days) and you have capital frozen in stock that should be liquid. Too low (under 35 days on a hero ASIN with long lead times) and you are one stockout away from losing rank, momentum, and Buy Box. Both extremes are capital errors. One is slow, one is sudden.
A steward tracks days of cover daily on the hero ASINs and weekly on everything else. It is the first metric the steward looks at in the morning, because it is the metric that turns into a crisis fastest.
Cash conversion cycle is the number of days between when you spend a dollar on inventory and when you collect a dollar from Amazon for selling the unit it became. It is a single number that captures how hard your capital is working.
The formula at the operator level: days of inventory + days of Amazon payout lag, minus days of supplier payment terms. If you are paying suppliers in 0 days (deposits), holding 90 days of inventory, and getting paid by Amazon in 14 days, your cash conversion cycle is 104 days. Every dollar you deploy takes 104 days to come back.
In Hot, that did not matter because capital was cheap and patient. In Tightened, that is the number that decides whether you can keep funding the business. Lower it by negotiating supplier terms, tightening days of cover, or shifting product mix toward faster-turning ASINs, and you have just generated capital without raising any.
Revenue per employee is the operating leverage ratio. It tells you whether your team is producing output or producing meetings.
For an Amazon brand running on a traditional team structure (a PPC manager, a listings manager, an inventory planner, a customer service lead, a brand manager, a founder), revenue per employee under $750,000 is a problem. Over $1.5M is healthy. Over $3M means you have built operating leverage that compounds.
The reason this matters in the Steward frame is that headcount is the second largest capital deployment most brands make after inventory, and it does not show up on the marketer dashboard at all. A steward asks: what is the marginal revenue per marginal hire. A marketer asks: who else can I hire.
These five metrics, tracked together, are the dashboard. EBITDA per ASIN tells you what is working. Contribution margin per unit tells you why. Days of cover tells you whether your inventory is healthy. Cash conversion cycle tells you how hard your capital is working. Revenue per employee tells you how hard your team is working.
Nothing else needs to be on the top page.
A dashboard without an operating cadence is wallpaper. Here is the cadence a steward runs against the five metrics. This plugs directly into the Amazon operations mission control cadence.
Daily (10 minutes, morning)
Cash position. Days of cover on hero ASINs. Account health (suppressions, IP claims, listing flags). This is the "is the building on fire" check. If any of these three is off, nothing else on the dashboard matters until you fix it.
Weekly (45 minutes, end of week)
EBITDA per ASIN, ranked top to bottom. Contribution margin trends on the top 20 ASINs (improving, flat, declining). Stockout risk on the next 60 days. Ad spend allocated to profit-positive vs profit-negative ASINs. This is where the operator actually steers. You are looking for ASINs sliding down the EBITDA ranking, margin trending the wrong way, and ad budget pointed at the wrong units.
Monthly (2 hours, first business day)
Cash conversion cycle. Revenue per employee. Capital allocation review. Which capital deployments from last month are paying off. Which are not. What is the next dollar going to. What needs to be cut.
The cadence matters because most operators run the wrong loop. They check ACoS every day and EBITDA per ASIN every quarter. Reverse it. EBITDA per ASIN is the operator's instrument. ACoS is a sub-component of one row inside it.
A steward never lets a marketer metric override a CFO metric. ACoS target gets adjusted to serve contribution margin per unit, not the other way around. Inventory reorder gets adjusted to serve cash conversion cycle, not just sell-through. PPC budget gets adjusted to serve EBITDA per ASIN, not just rank. The CFO frame is always the parent decision. The marketer metrics are inputs.
The reason the Steward of Capital frame is more than a dashboard is that it changes how you make decisions. Every dollar you deploy as an Amazon operator is a capital allocation decision. Buying inventory is a capital allocation decision. Funding a new ASIN launch is a capital allocation decision. Running a deeper promo is a capital allocation decision. Hiring is a capital allocation decision.
Before deploying any dollar, a steward runs the dollar through four questions.
1. What is the expected EBITDA return on this dollar
Not the expected revenue return. The expected EBITDA return. If I put $50,000 of inventory into ASIN A versus ASIN B versus a new launch, what is the EBITDA each path generates after every variable and allocated cost. If the answer is "I don't know," do not deploy yet. Build the model. Even a rough model beats no model. The Amazon unit economics view is the right starting point.
2. What is the time-to-return
Money you get back in 30 days is more valuable than money you get back in 180 days, even at the same EBITDA. Time-to-return is the bridge between EBITDA and cash conversion cycle. A capital deployment with a 25% return in 45 days is usually better than a 40% return in 180 days, especially in Tightened when your alternative use of that capital is high. A steward asks how fast, not just how much.
3. What is the alternative use of this dollar
Capital has opportunity cost. Every dollar you put into ASIN A is a dollar you did not put into ASIN B, did not put into negotiating better supplier terms, did not keep on the balance sheet for the next disruption. A steward does not evaluate deployments in isolation. They evaluate against the next best alternative. If ASIN A pays 18% in 90 days and ASIN B pays 28% in 60 days, ASIN A is a worse use of capital even if both are positive.
4. What is the downside if the assumption is wrong
Every capital deployment has an assumption underneath it. Demand will hold. Lead time will be 45 days. PPC will land at this ACoS. Margin will hold at this level. A steward asks: what happens if the assumption is wrong by 20%. If a 20% miss kills the brand, that is not a capital deployment, that is a bet. Stewards do not bet the business on a single assumption. They size deployments so that a 20% miss is a setback, not a death.
These four questions, asked in this order, separate operators from gamblers. In a Hot phase, you can skip the questions because cheap capital absorbs the mistakes. In Tightened, the questions are the operating system.
Here is the honest problem with the Steward of Capital frame. It does not work at scale without help.
Tracking EBITDA per ASIN on a 200-SKU catalog, weekly, by hand, is a full-time finance job. Watching contribution margin trends on the top 20 ASINs and flagging the ones sliding the wrong way is another job. Monitoring days of cover by ASIN across multiple FBA warehouses and 3PLs is another job. Running cash conversion cycle monthly with supplier-by-supplier payment terms is another. The combined load is more than a single founder, or even a small ops team, can carry consistently.
That is why most brand owners abandon the steward frame within two weeks of trying it. The frame is correct. The operational load is too heavy.
This is exactly what AI agents fix. The AI operating system for Amazon brands is built so that the watching layer is automated. Agents calculate EBITDA per ASIN in the background, every day, against the latest cost data. Agents watch contribution margin trends and flag the ASINs that crossed a threshold. Agents track days of cover by ASIN and surface the ones heading toward stockout or overstock. Agents compute cash conversion cycle and tell you what changed.
The human does not do the watching. The human does the capital allocation. The four questions. The hard calls about which ASINs to feed, hold, fix, or kill.
That division of labor is what makes the Steward of Capital frame practical at the scale most Amazon brands actually operate at. The frame is not new. CFOs of public companies have run versions of it for fifty years. What is new is that an Amazon operator with a $5M to $50M brand can now run it without hiring a finance team, because the watching layer is software.
That is the whole point of the AI operating system. Not to replace the operator. To finally give the operator the dashboard they should have had for the last ten years.
The Steward of Capital frame is the operator mindset for the Tightened phase, and the next phase after it. It reads like this.
Spaces on the calendar are more impressive than zeros in a bank account, and EBITDA per ASIN is more impressive than revenue.
You are not the head of marketing for your Amazon brand. You are the steward of the capital your brand is built on. Your dashboard, your cadence, your decisions, your software stack, and your team structure all flow from that one frame.
The brands that survive this phase are the ones that internalize it. The brands that don't will look at their marketer dashboards for another six quarters, post fine-looking revenue numbers, run out of cash, and quietly disappear into distressed Amazon businesses listings at 1.8x EBITDA.
If you want help building the steward dashboard on top of your catalog, including agents that watch the five metrics for you so you can spend your time on the four questions, apply here. We do not work with every brand. We work with operators who already understand that the marketer era is over and want to run the next era like a CFO.
The Steward of Capital frame is the operator mindset that says your job is not to generate revenue, but to generate revenue in relation to the capital you have deployed. It treats an Amazon brand like a portfolio of capital allocations (inventory, ad spend, headcount, launches) rather than a marketing channel. The operator's dashboard becomes CFO metrics (EBITDA per ASIN, contribution margin per unit, days of cover, cash conversion cycle, revenue per employee) instead of marketer metrics (revenue, ACoS, rank, sessions).
A marketer mindset optimizes for top-line growth and traffic. Revenue, ACoS, ranking, sessions, conversion rate. A steward mindset optimizes for capital efficiency. EBITDA per ASIN, contribution margin per unit, cash conversion cycle. The marketer asks "how do I grow faster." The steward asks "what is the EBITDA return on this dollar, and how fast does it come back." In a Hot capital phase, the marketer frame wins. In the Tightened phase we are in now, the steward frame is the only one that survives.
Three things, daily, in ten minutes. Cash position. Days of cover on your hero ASINs. Account health (suppressions, IP claims, listing flags). Everything else (EBITDA per ASIN, contribution margin trends, ad allocation) runs on a weekly or monthly cadence. The daily check is the "is the building on fire" check. If any of the three is off, nothing else matters until you fix it.
Because total revenue lies. A brand can grow revenue 18% while EBITDA grows 2%, which means the operator bought more revenue with less efficient capital. EBITDA per ASIN, ranked top to bottom, tells you exactly which units are generating real profit, which are flat, and which are burning capital after you load in all the costs (PPC, FBA, returns, storage, chargebacks, allocated overhead). The top 10% of ASINs typically carry 70% to 90% of EBITDA. You cannot make good capital decisions without that view.
The operator-level formula: days of inventory on hand, plus days of Amazon payout lag, minus days of supplier payment terms. If you pay suppliers up front (0 days), hold 90 days of inventory, and Amazon pays you in 14 days, your cash conversion cycle is 104 days. That is the number of days every dollar of capital you deploy takes to come back as cash. Shorter is better. You shorten it by negotiating supplier terms, tightening days of cover, or shifting mix toward faster-turning ASINs.
Profit, measured as EBITDA per ASIN and contribution margin per unit. The exit math that rewarded top-line growth (3x and 4x revenue multiples from aggregators) is gone for the foreseeable future. The brands getting funded, bought, or recapitalized in 2026 are the ones with clean unit economics and a real EBITDA story. Growth is fine if it is profitable growth, but growth bought at the expense of contribution margin is now a liability, not an asset. Read how to value an Amazon brand in 2026 for the current multiple environment.
It pushes the stack from marketing tools to operating tools. PPC bid management software, listing optimization tools, and rank trackers are still useful, but they sit underneath the steward dashboard, not at the center of it. The center becomes an AI operating system that calculates EBITDA per ASIN, watches contribution margin trends, tracks days of cover across warehouses, and computes cash conversion cycle in the background. The human spends their time on capital allocation decisions, not on tab-switching between seven dashboards. That shift, from marketer tools to operator tools, is the practical version of the Steward of Capital frame.