Chad Rubin
June 23, 2026 · 11 min read
Operator notes by email
Short, opinionated takes on AI agents, Amazon PPC, pricing, and inventory. No fluff. About once a week.
I am going to make a claim that sounds extreme and is actually obvious once you sit with it for ten minutes. ACoS is a metric Amazon built to keep you poor. ROAS is the same metric with a different unit of measure. Both were designed to inflate ad spend, flatter agencies, and hide the true cost of acquiring a customer. The only number an Amazon operator should actually read is EBITDA per ASIN.
I have run Amazon brands for 15 years. I have hired the agencies, run the spreadsheets, watched dashboards, and made every mistake an operator can make. The biggest mistake I made consistently for the first decade was operating against ACoS instead of against profit. The agencies loved it. The PPC tools loved it. The ad budget grew. The brand grew. And the bank account grew slower than it should have, because the dashboard I was running on was lying to me by design.
This is the post that explains the lie, gives you the alternative dashboard, and tells you what to do about it on Monday morning.
## Key takeaways >- ACoS measures the percentage of ad-attributed revenue you spent on ads. It hides COGS, fees, returns, and overhead. A 25% ACoS can be very profitable or deeply unprofitable.- ROAS is ACoS expressed as a ratio. Same metric. Same problem.- EBITDA per ASIN is the only number that survives the test of "does this make me money?" because it accounts for the actual unit economics of the product.- Most agencies report against ACoS specifically because it is the metric that lets them grow ad spend without being accountable for profit.- The fix is replacing the marketer dashboard with the steward dashboard: EBITDA per ASIN, contribution margin per unit, target POAS (Profit on Ad Spend), and TACoS as a ceiling not a target.
ACoS is "ad cost as a percentage of ad-attributed sales." If you spend $25 on ads and those ads drive $100 of sales, your ACoS is 25%. Sounds clean.
Here is what ACoS does not include in the denominator: cost of goods sold. Amazon referral fees. FBA fees. Return fees. Storage fees. The cost of the customer who clicked the ad and bought a competitor's product that came up in retargeting. The CAC of the customer who returned in 60 days. Overhead. Taxes.
A 25% ACoS sounds like 75% margin. It is nothing of the kind. After you back out the actual cost structure of selling a unit on Amazon, the same product at 25% ACoS might be running at 8% contribution margin, or 2%, or zero, or negative. The ACoS number does not tell you which.
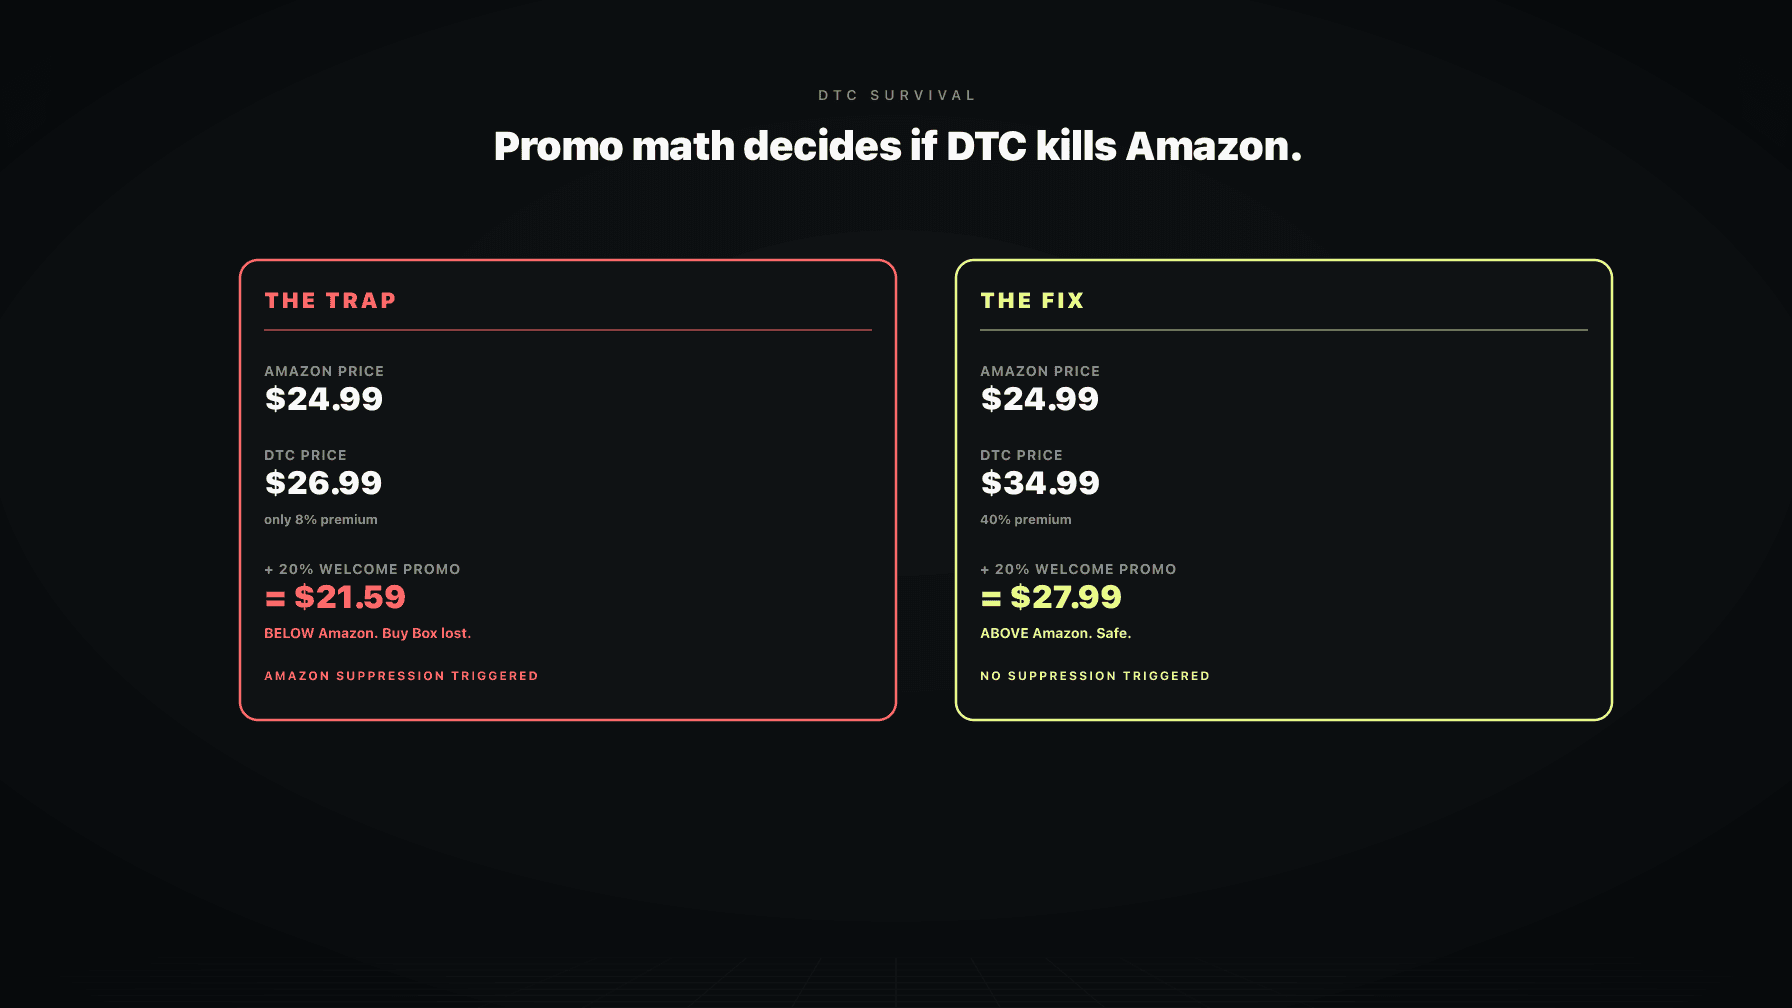
The unit economics post shows the full waterfall. On a typical $24.99 ASIN, the path from gross revenue to actual unit profit looks something like: $24.99 price minus $3.75 referral fee minus $5.40 FBA fee minus $8 COGS minus $1.20 returns reserve minus $4.00 ad cost (at a 16% ACoS that the agency would call exceptional) equals $2.64 contribution margin. That is a 10.6% net unit margin after the dust settles. The agency dashboard would call this campaign a runaway success at 16% ACoS. The operator dashboard would call it barely profitable.
From reading to action
If the framework above sounds familiar, your Amazon account is probably carrying the same drag. Apply and we will show what Marko, Oracle, and Bruno would change in your first week.

Ran a 7-figure Amazon brand for a decade. Founded Skubana (acquired). Co-founded Prosper Show. 15+ years on Amazon.
Join the brands that replaced agencies and tools with AI employees.
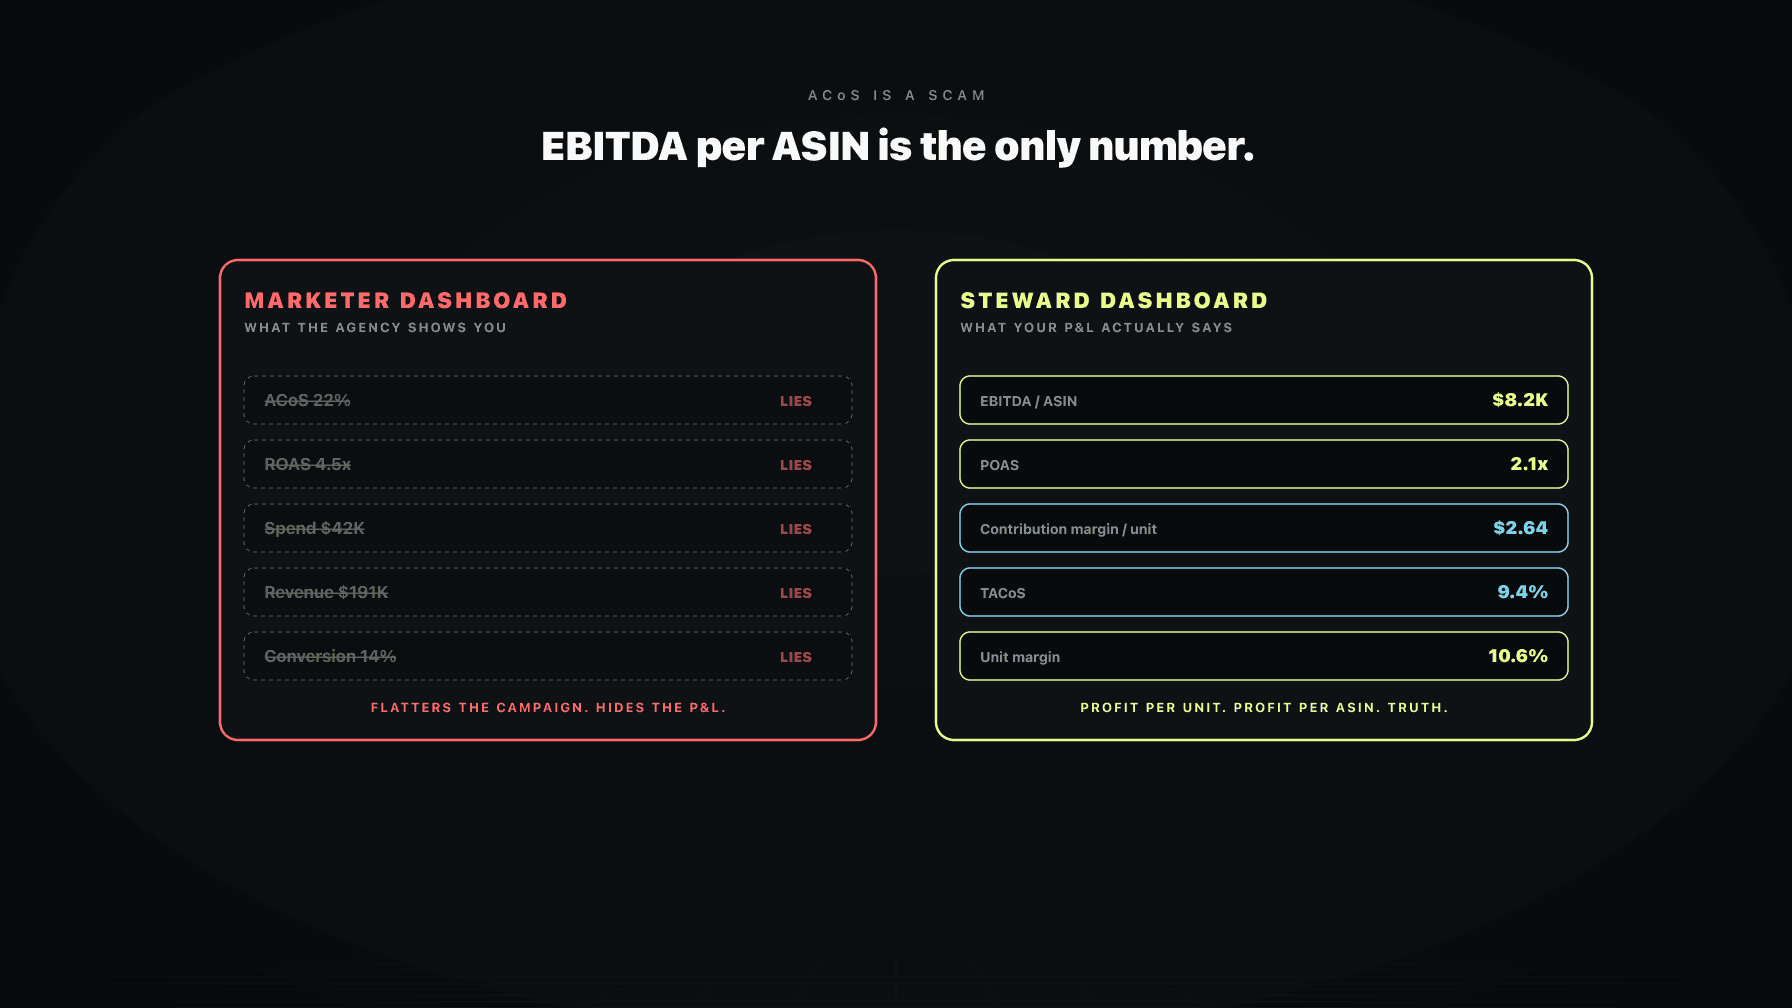
This is the asymmetry the agency depends on. The ACoS number flatters the campaign. The EBITDA number tells the truth.
Amazon's incentive structure aligns with ad spend, not with seller profit. The ad business is one of Amazon's largest and fastest-growing revenue lines. Every dollar of seller ad spend is Amazon revenue. Amazon does not build seller dashboards optimized for seller profit. Amazon builds seller dashboards optimized for seller ad spend with enough margin lift to keep the seller from quitting.
ACoS is the perfect metric for that incentive. It is comprehensible. It looks like a profit metric to anyone who does not look carefully. It scales linearly with ad spend (you can hit "exceptional" ACoS at any spend level if you tune campaigns enough). It lets sellers feel like they are doing well even when the unit economics underneath are bleeding.
I am not saying this is malicious. I am saying it is structural. Amazon is a public company with a duty to maximize Amazon's profit. The dashboard they give you is the one that serves their P&L. If you operate against it without translating to your own P&L, you are running your business on someone else's instrument.
If you have ever worked with an Amazon PPC agency, you have read a report that highlights ACoS prominently. Sometimes ROAS. Almost never contribution margin per unit. Almost never EBITDA by ASIN.
There is a reason. Agencies are compensated on either retainer or percentage of ad spend. Both compensation structures benefit when ad spend grows. ACoS is the metric that lets an agency grow spend while telling you the campaigns are healthy. The agency runs three campaigns: one at 8% ACoS (very profitable), one at 18% ACoS (probably profitable), one at 32% ACoS (probably unprofitable on contribution margin). They report the blended average of 19%. They tell you the account is performing well. The 32% ACoS campaign is the one growing fastest because the bids are higher. The unprofitable side is growing while the profitable side is starving.
If they reported on EBITDA per ASIN, the conversation would be different. The 32% ACoS campaign would show negative contribution margin and the agency would have to defend why they kept running it. The defense is hard. So they do not report against that number.
The PPC agency alternative post covers the structural issue with agency incentives in more depth. The metric framework here is the most leverage-rich way to expose it.
If ACoS is the wrong number, what is the right number? It is not one number. It is a stack of four, each accountable for a different part of the picture. Together they make ACoS obsolete and give you operator-grade visibility on profit per unit, per ASIN, per campaign, and across the whole account.
The headline number. For each ASIN, what is the total contribution to EBITDA across all the units that sold in the period? This is the only number that answers "is this product making me money?"
You calculate it the same way you calculate it for the whole brand. Revenue minus COGS minus fees minus ad cost minus returns minus storage minus allocated overhead. Total dollars contributed to EBITDA. Rank ASINs by this number monthly. The top 20% drive most of the profit. The bottom 20% might be losing money in the dark, hidden by their tiny share of revenue and their flattering ACoS.
The contribution margin per unit post walks the math at the unit level. EBITDA per ASIN aggregates it.
The unit-level companion to EBITDA per ASIN. For a unit sold at $24.99, what is the contribution margin after every variable cost? If the answer is $2.64, you have $2.64 of room to absorb ad spend before the unit starts losing money. That is the ceiling on what you can pay to acquire the customer.
Contribution margin per unit is the input to the only ad-spend question that matters: how much can I pay to acquire this customer and still have positive EBITDA? Most agencies do not know the answer for your specific product because they do not have your COGS, your returns rate, or your storage costs. They are bidding based on what looks good on their dashboard. You should be bidding based on what your contribution margin will tolerate.
POAS is ROAS replaced with profit. Instead of "revenue per dollar of ad spend", it is "contribution margin per dollar of ad spend." A campaign at 4x ROAS sounds great until you find out the products have 12% net unit margin, which puts the campaign just barely above water. A campaign at 2x POAS is genuinely profitable because the 2x is measured against profit, not gross revenue.
The target POAS post covers the math and how to set the target. The short version: pick a POAS floor that maintains contribution margin per unit above zero, and use that as the campaign performance threshold. Anything below floor gets paused. Anything above gets fed.
TACoS (Total Advertising Cost of Sales) is ad spend divided by total revenue, not just ad-attributed revenue. It is a healthier metric than ACoS because the denominator includes organic sales. A rising TACoS over time is a warning that ad spend is replacing organic, not adding to it.
TACoS is most useful as a ceiling. "Keep TACoS under 12%" is a reasonable account-level guardrail. Below the ceiling, you let the steward dashboard (EBITDA per ASIN, POAS, contribution margin per unit) drive decisions. Above the ceiling, you pull back because the ad efficiency at the account level is degrading.
The TACoS explained post covers this in detail.
If you take one action from this post, take this. The next time your agency, your PPC tool, your VA, or your internal dashboard reports against ACoS, push back. Ask for the same campaign performance broken out by EBITDA contribution per ASIN. Most agencies cannot do it. Most PPC tools cannot do it because they were never built to. Both of those facts tell you something about where the industry is.
The agencies and tools that can do it are the ones worth working with. The ones that cannot are the ones that depend on the ACoS lie to keep your business.
When you make the switch internally, the immediate effect is that some campaigns you thought were healthy turn out to be unprofitable. Pause them. Some campaigns you were about to cut turn out to be highly profitable on contribution margin even with mediocre ACoS. Scale them. The reallocation usually produces a 10-20% profit lift in the first 60 days without changing total spend.
This is the Steward of Capital frame applied to PPC specifically. You are not generating revenue. You are generating revenue in relation to budget. The frame changes the dashboard. The dashboard changes the decisions. The decisions change the P&L.
This is the deeper reason most PPC tools cannot give you EBITDA-per-ASIN reporting. They were built when ACoS was the industry-standard metric. The decision logic underneath them runs against ACoS targets. The bid algorithms optimize for ACoS thresholds. Even if you put a contribution-margin number into the tool, the tool does not know what to do with it because its decision tree does not branch on profit.
A real AI PPC agent does. The agent reads COGS by ASIN, referral fee schedule, FBA fee schedule, returns rates, and ad spend in real time. It calculates contribution margin per unit per ASIN. It bids against the margin, not against ACoS. When the margin on an ASIN drops (because COGS went up or returns spiked or Amazon raised fees), the agent reduces bids automatically. When the margin improves, the agent feeds the campaigns harder.
This is what Marko does. It operates against EBITDA per ASIN, not against ACoS targets, because that is the metric that matters. The ACoS number shows up in the audit log so the operator can see it. The decision logic underneath ignores it.
The broader point: when the dashboard changes, the decisions change. When the decisions change, the P&L changes. When the P&L changes, the entire reason for running an Amazon brand becomes legible again, instead of being hidden behind a metric Amazon built to flatter you.
Here is the audit to run this week.
This single exercise typically reallocates 10-30% of ad spend within a month and produces a measurable EBITDA lift. The PPC dashboard does not change visually. The economics underneath change dramatically.
We are in the Tightened phase of the Amazon Capital Cycle. Capital is scarce, margins are compressed, and the brands that survive are the ones with the cleanest unit economics. Operating against ACoS in a Hot phase is expensive. Operating against ACoS in a Tightened phase is fatal.
The good news is that the switch is mostly cognitive, not technical. The data exists. The math is not hard. The change is in which numbers you look at and which decisions you make on the basis of which numbers. Once you make the switch you cannot unsee it. The ACoS dashboard starts to look like the marketing-flattering tool it always was.
ACoS hides everything except ad-attributed revenue. It excludes COGS, fees, returns, storage, and overhead. A campaign with 25% ACoS can be highly profitable, marginally profitable, break-even, or unprofitable depending on the underlying unit economics, and ACoS gives you no way to tell which.
EBITDA per ASIN is the total contribution to operating profit from each ASIN over a period. It accounts for COGS, all Amazon fees, ad spend, returns, and overhead. It is the only metric that tells you whether a specific product is genuinely making you money. Ranking ASINs by EBITDA contribution monthly is the foundational operator move that ACoS dashboards prevent.
Revenue per ASIN minus COGS per ASIN minus referral fees minus FBA fees minus returns and refunds minus ad spend per ASIN minus allocated storage minus allocated overhead. Sum across all units sold in the period. The unit economics post and the contribution margin per unit post cover the math in detail.
POAS (Profit on Ad Spend) is ROAS replaced with profit instead of revenue. ROAS says "I made $4 in revenue for every $1 of ad spend." POAS says "I made $0.80 in contribution margin for every $1 of ad spend." POAS is the only ad-efficiency metric that survives operator scrutiny because the numerator reflects what actually hit your bank account.
TACoS is better than ACoS but still not the right operating metric. TACoS measures ad spend against total revenue (including organic), which is a healthier denominator than ACoS. Use TACoS as a ceiling at the account level. Use EBITDA per ASIN and POAS as the operating metrics that drive decisions.
Because ACoS lets them grow ad spend without being accountable for profit. The agency's compensation grows with ad spend. EBITDA per ASIN would expose the campaigns that are growing spend without growing profit. ACoS hides those campaigns inside a blended account-level number that looks healthy. This is the structural reason most agency relationships eventually fail on the operator's P&L.
Most existing PPC tools cannot do this because they were built around ACoS targets and do not have the COGS, fee, or returns data needed to calculate contribution margin per unit. The tools that can are the ones that operate as part of a coordinated AI operating system where a pricing agent sees the same data as the PPC agent. The single-function PPC tool is structurally limited here.
If you take nothing else from this post, take this. The dashboard you stare at every day is shaping the decisions you make. If the dashboard is ACoS, you are making decisions that grow ad spend regardless of profit. If the dashboard is EBITDA per ASIN, you are making decisions that grow profit regardless of ad spend.
Pick the dashboard that runs the business you actually want to own.
If you want to see what an EBITDA-driven PPC agent looks like in practice, apply here and we will put Marko on your account in observe mode. The dashboard difference will be visible inside 30 days.